
Node Monitoring
Collect node and container health metrics and stream them for live viewing via Remote GUI or persistent storage across Operator nodes.
Each AnyLog node can collect its own health metrics and distribute them in one or both of two ways:
- Live view — push metrics to a Query Node and visualise them in the Remote GUI without storing any data
- Persistent storage — stream metrics into an Operator’s database for historical queries and dashboards
The monitoring schedule is deployed as a blockchain policy and activated automatically when NODE_MONITORING=true is set in the node configuration.
Pull, not push: unlike Syslog, where data is pushed into AnyLog by an external forwarder (rsyslog), node and Docker monitoring are pulled on a schedule — the node actively queries its own OS and Docker metrics at each interval, rather than waiting for something to send data in.
A node generates its own “insight” — a JSON object describing its current state. Two kinds exist on this page:
| Insight type | What it captures | Sent to Query Node (live view) | Sent to Operator (archive) |
|---|---|---|---|
node_insight |
OS/agent-level metrics — CPU, disk, network, ingestion stats (see below) | ✅ | ✅ |
docker_insight |
Container-level stats (see Docker Monitoring) | ❌ | ✅ |
The reason for that split:
- Query Node — a live, in-memory snapshot, almost like running
topacross every node in the network. It only makes sense for metrics you’d want to glance at right now. - Operator — a persistent archive for historical queries, trending, and dashboards. This is where you’d look to answer “what happened over the last week,” not “what’s happening this second.”
docker_insight is only sent to the Operator archive — there’s no live-view path for it (see the Docker Monitoring
section below).
Prerequisite: any form of monitoring on this page — node insight collection, live view, persistent storage, or Docker monitoring below — runs as a scheduled task. The scheduler itself must be enabled, or nothing will fire:
run scheduler 1
Collecting node insight
Each participating node runs a set of scheduled tasks that build a JSON object called node_insight. This object is assembled from system metrics collected at two intervals:
| Metric | AnyLog command | Frequency |
|---|---|---|
| Operator ingestion stats | get stats where service = operator and topic = summary |
!monitoring_frequency |
| Timestamp | get datetime local now() |
!monitoring_frequency |
| Node type | !node_type |
!monitoring_frequency |
| Disk free (%) | get disk percentage . |
30 seconds |
| CPU usage (%) | get node info cpu_percent |
30 seconds |
| Network packets received | get node info net_io_counters packets_recv |
30 seconds |
| Network packets sent | get node info net_io_counters packets_sent |
30 seconds |
| Network error count | errin + errout |
30 seconds |
| Status | Active |
30 seconds |
The resulting node_insight object:
{
  "timestamp": "2026-03-07 18:41:11",
  "node type": "operator",
  "Free Space Percent": 72.4,
  "CPU Percent": 6.7,
  "Packets Recv": 1482930,
  "Packets Sent": 983421,
  "Network Error": 0,
  "status": "Active"
}
!monitoring_frequency is set in the node’s .env file (default: 60 seconds). Hardware metrics always collect at 30 seconds regardless.
Option 1 — Live view via Remote GUI
Each node pushes its node_insight to the Query Node, which aggregates status from all participating nodes into a single view. The Remote GUI reads from the Query Node to display a live network-wide dashboard — no database required.
Node A  ──┐
Node B  ──┼──► Query Node  ──► Remote GUI
Node C  ──┘     (aggregator)
The Query Node destination is resolved automatically from the blockchain:
view_monitoring_dest = blockchain get query bring.ip_port
Each node then pushes its metrics on a 30-second schedule:
run client (!view_monitoring_dest) monitor operators where info = !node_insight
The Remote GUI Monitor Node section shows a live table of all nodes pushing metrics to the Query Node:
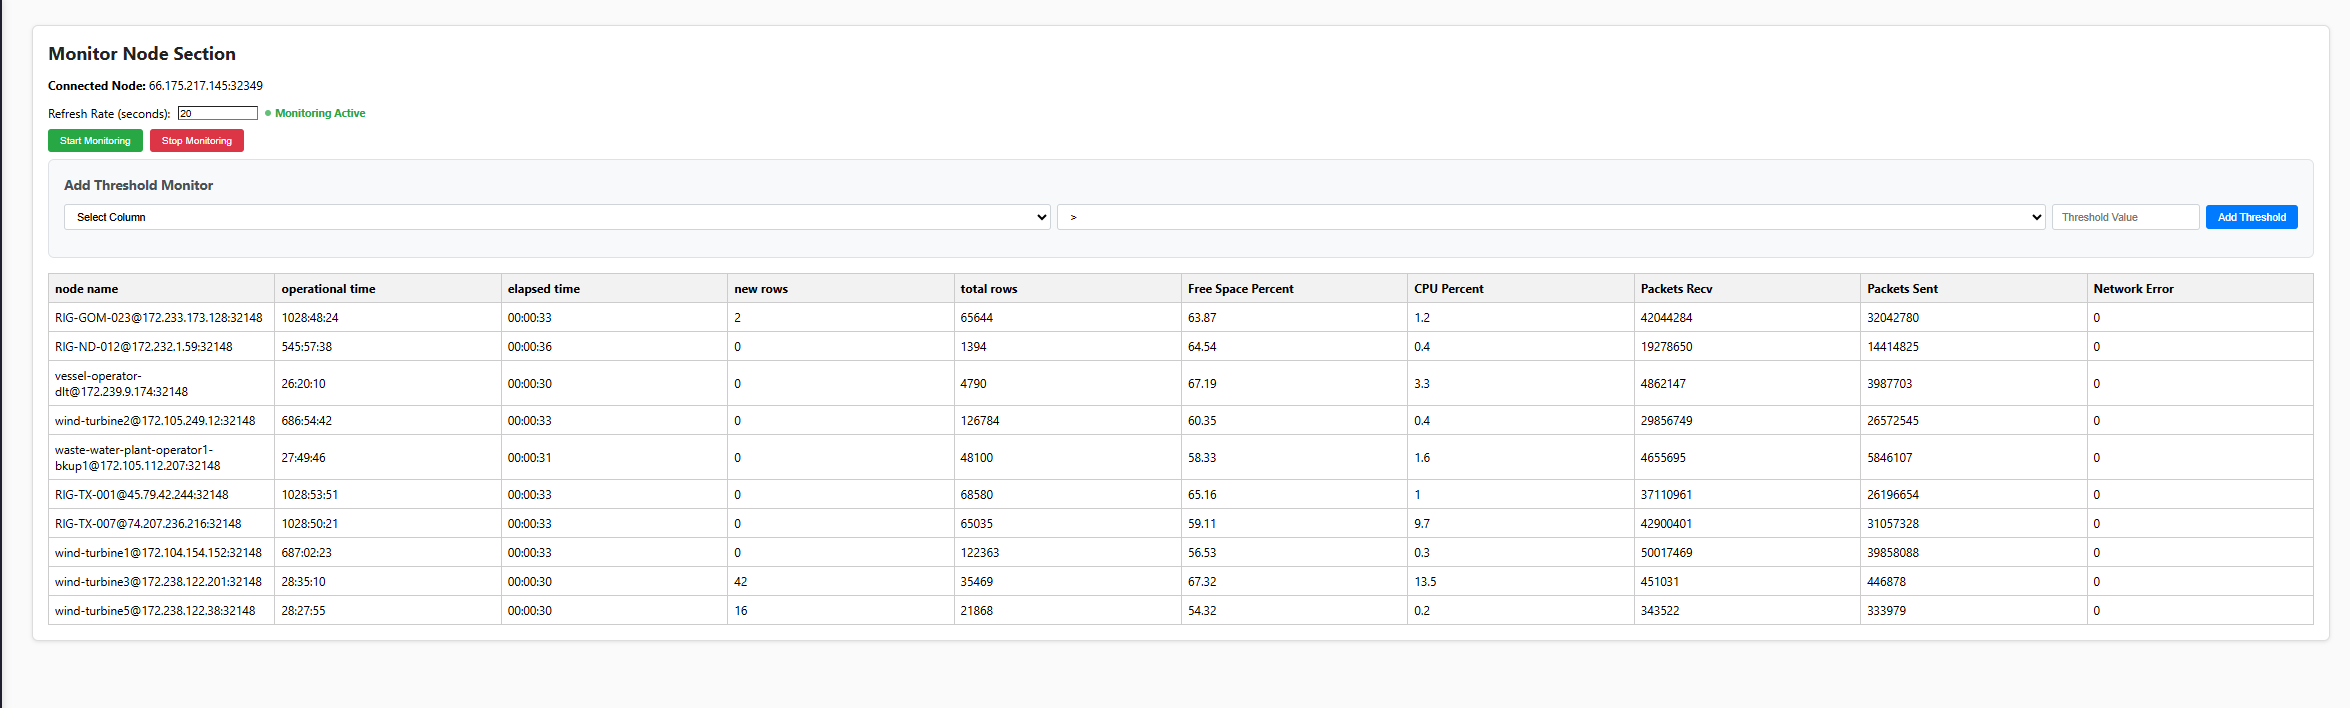
Each row represents one node, showing its name, operational time, elapsed time since last update, new and total rows ingested, and the hardware metrics — free disk space, CPU usage, network packets, and error count.
The Add Threshold Monitor panel at the top lets you set alert thresholds on any column — for example, alert when CPU Percent exceeds 80 or Free Space Percent drops below 20.
View from the CLI:
get monitored                          # list all monitored topics
get monitored operators                # current status from all nodes
reset monitored operators              # clear the aggregated list
This option requires no storage configuration — metrics are held in memory on the Query Node and reflect the current state only.
Option 2 — Persistent storage across Operators
When STORE_MONITORING=true, each node streams its node_insight into a monitoring.node_insight table on an
Operator node, enabling historical queries and Grafana dashboards.
Node A  ──┐
Node B  ──┼──► Operator (monitoring.node_insight)
Node C  ──┘
On Operator nodes — stored locally:
stream !node_insight where dbms = monitoring and table = node_insight
On non-Operator nodes — routed to a remote Operator:
run client (!monitoring_storage_dest) stream !node_insight where dbms = monitoring and table = node_insight
The target Operator is resolved automatically:
monitoring_storage_dest = blockchain get operator bring.last [*][ip]:[*][port]
Table setup
On the Operator hosting the monitoring data, the node_insight table is created automatically on startup:
connect dbms monitoring where type = sqlite
process !anylog_path/deployment-scripts/southbound-monitoring/create_node_monitoring_table.al
Querying stored metrics
# Local query on the Operator
sql monitoring format = table "select * from node_insight order by timestamp desc limit 20"

# Network query from any node
run client () sql monitoring format = table "select timestamp, node_type, cpu_percent, free_space_percent from node_insight where timestamp >= NOW() - 1 hour"
Using both options together
Options 1 and 2 are not mutually exclusive. Most deployments run both — live view for real-time dashboards and persistent storage for historical analysis and alerting.
Docker Monitoring
In addition to node-level health metrics, AnyLog can pull container-level stats directly from Docker using a scheduled pull task — the same general-purpose mechanism used for things like Windows Event Log ingestion.
Unlike node_insight (which can go to both the Query Node for live view and an Operator for archiving —
see Option 1 / Option 2
above), docker_insight is forwarded to an Operator node only. There’s no live-view equivalent for Docker
metrics — the goal here is archival, not a real-time snapshot.
Prerequisite: Docker monitoring reads container stats via the Docker socket (typically
/var/run/docker.sockon the host). To verify: confirm the exact AnyLog-side configuration for pointing at this path (dictionary variable, mount path, or otherwise) before publishing — that detail wasn’t provided here and shouldn’t be guessed at.
Enable the pull
run scheduled pull where name = docker_insights and type = docker and frequency = !docker_frequency and continuous = false and dbms = monitoring and table = docker_insight
This streams container stats into monitoring.docker_insight — the same monitoring logical database used for
node_insight above, so both can be queried side by side.
Command reference
run scheduled pull is a general-purpose command — type = docker is one of several supported source types (another
being eventlog, shown below):
AL > help run scheduled pull

Usage:
        run scheduled pull where name = [unique name] and type = [log typ
e] and source = [localhost or IP] and frequency = [in seconds] and dbms = [dbms name] and table = [table name]

Explanation:
        Periodically retrieve data from a specified source (such as Windows Event Log) and insert it into a defined table.

Examples:
        run scheduled pull where name = local_events and type = eventlog
and source = localhost and frequency = 1 and dbms = sensor_data and table = event_log

Index:
        ['streaming', 'api', 'configuration', 'background processes']
Querying Docker stats
run client () sql monitoring format = table "select * from docker_insight order by timestamp desc limit 20"
Configuration
| Variable | Description | Default |
|---|---|---|
NODE_MONITORING |
Enable the monitoring schedule | true |
STORE_MONITORING |
Enable persistent storage to Operator | true |
MONITORING_FREQUENCY |
Collection frequency for operator stats | 60 seconds |
DOCKER_FREQUENCY |
Collection frequency for run scheduled pull docker stats — used as !docker_frequency above |
(to verify — not specified in source material) |
The monitoring schedule is stored as a blockchain policy and can be inspected at any time:
blockchain get schedule where id = node-monitoring