Qlik
Demonstration on how to connect between AnyLog and Qlik BI REST service
Qlik is a data integration, analytics, and artificial intelligence platform. Using their REST connector plugin, users are able to pull data from AnyLog/EdgeLake and use it to generate insight on their data.
Requirements
- An active AnyLog network
- A subscription with Qlik
Preparing the Environment
- From Home goto Create
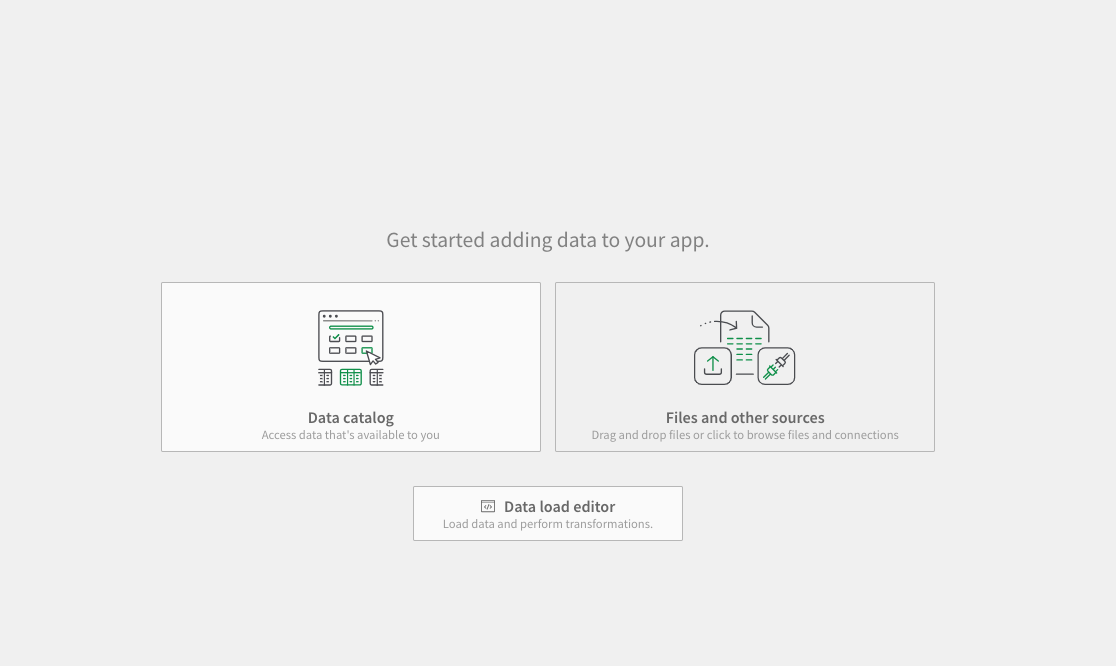
- In Create we want to use the Analytics App
- Data is coming from Files & Other Data Sources
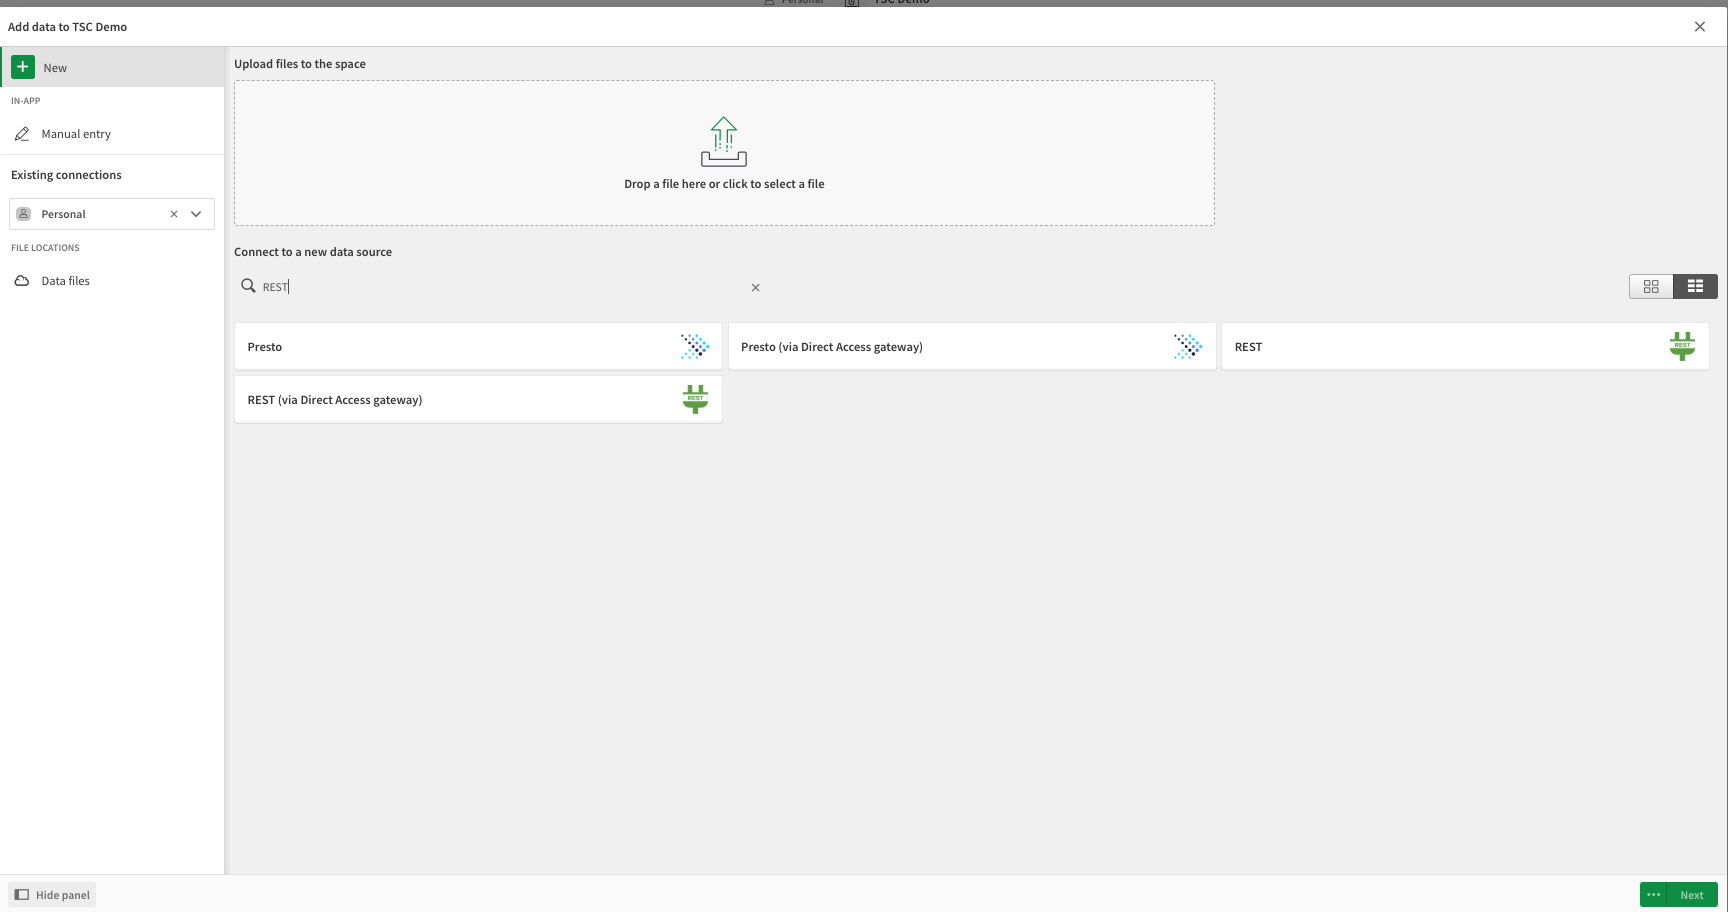
- We use a standard REST
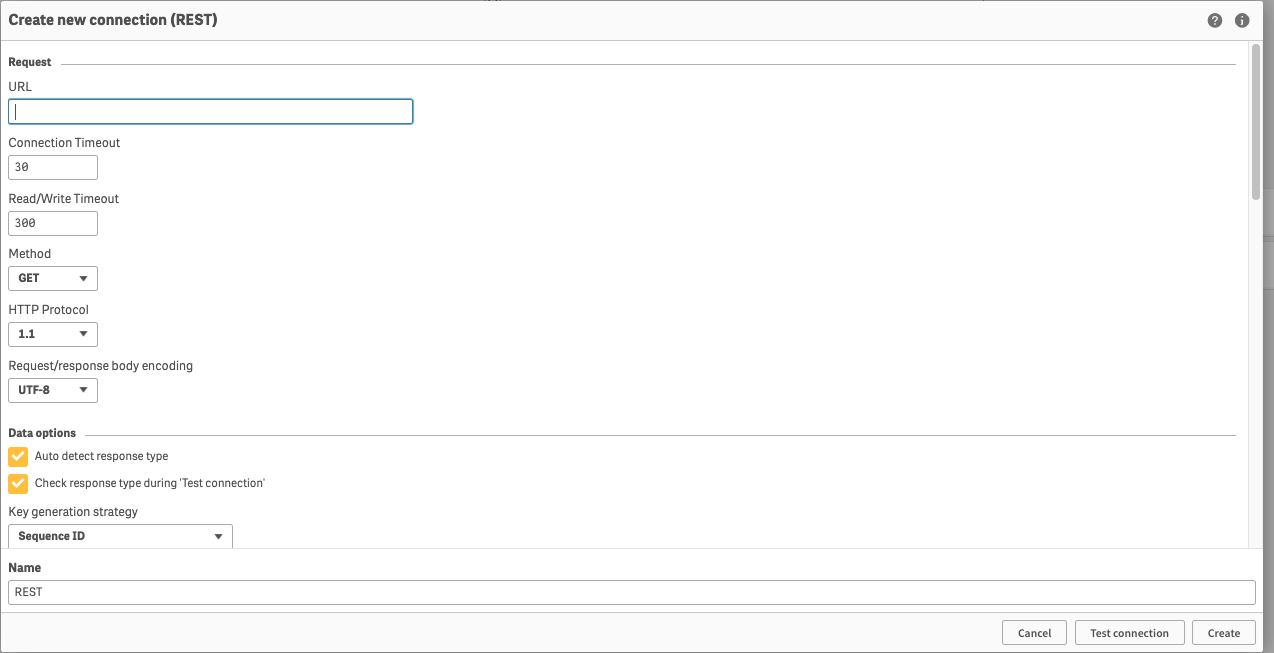
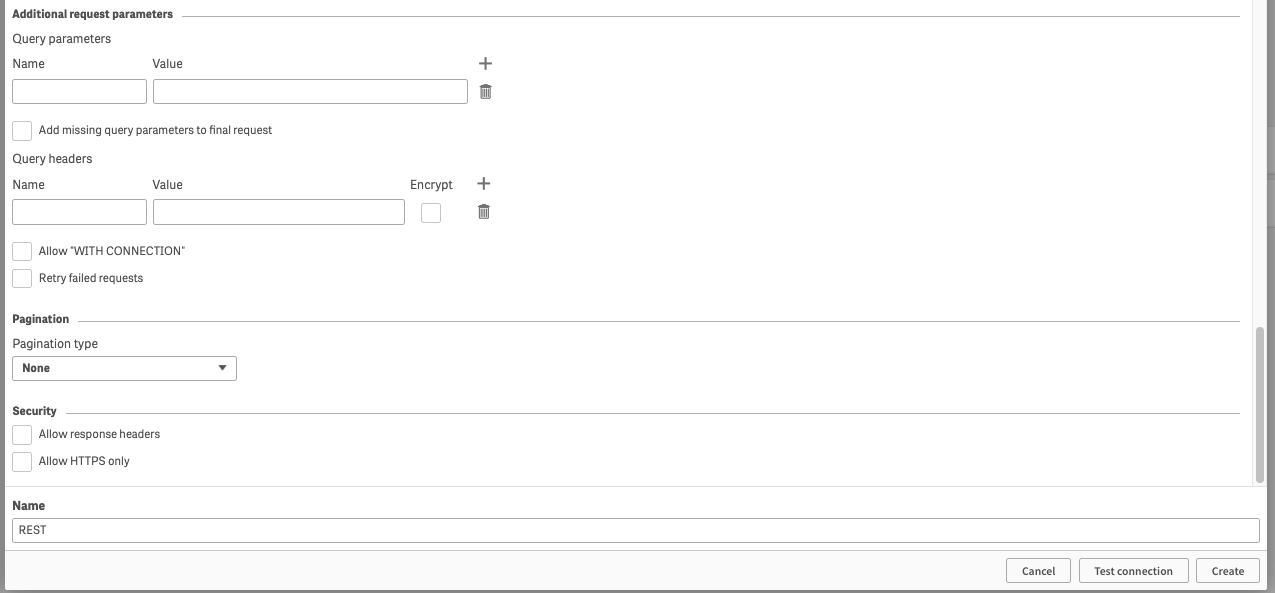
For this demo we’ll be creating REST connections for increments and period function respectively. The main components of the REST interface delt with are the URL bar and cURL request headers.
 |  |
Increments Data
The increments function is used to segment time-series data into fixed, contiguous time intervals (e.g., every 5 minutes, every hour, every day).
- For the URL specify the REST IP and port of the node to send the request against
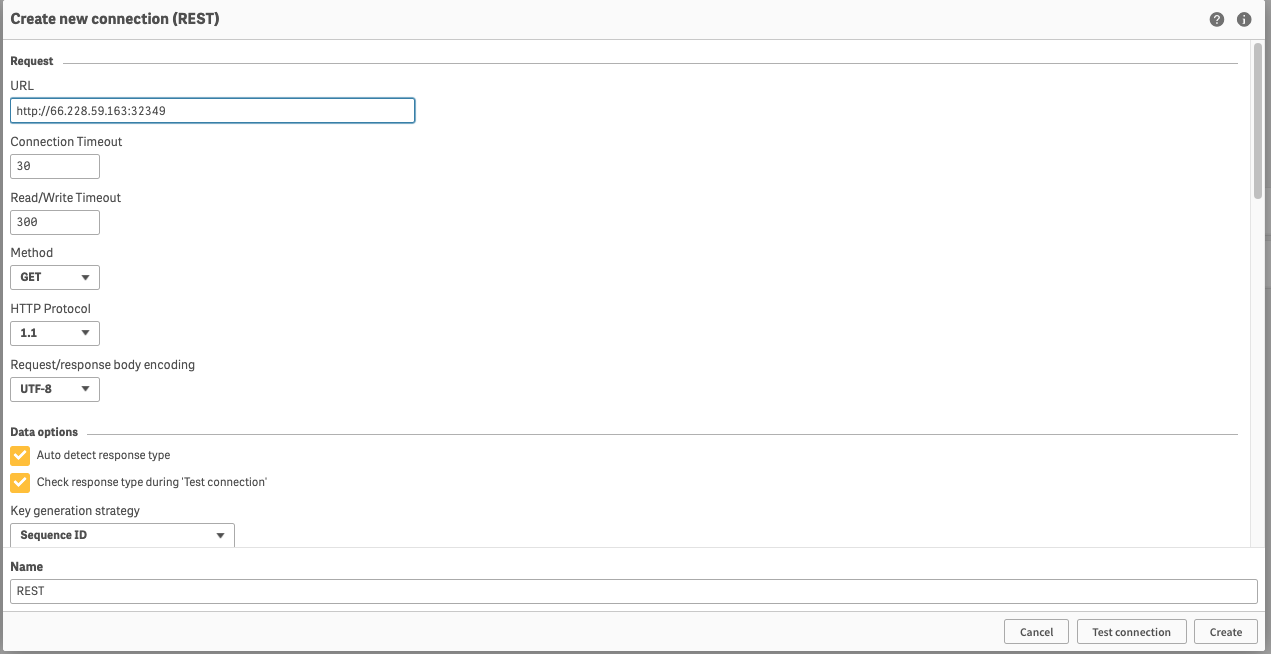
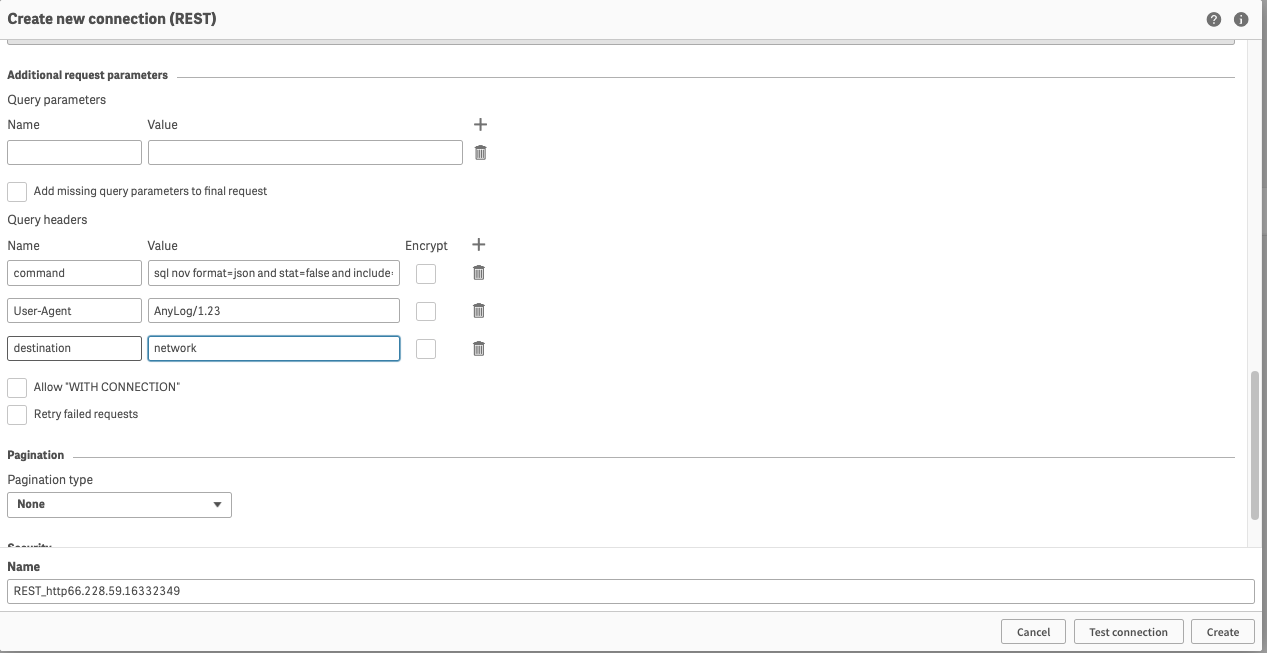
- In the headers section add the following params:
- command:
sql nov format=json and stat=false and include=(t2) and extend=(@table_name) "select increments(second, 1, timestamp), min(timestamp) as timestamp, min(value) as min_val, avg(value) as avg_val, max(value) as max_val from t1 WHERE timestamp >= NOW() - 15 minutes ORDER BY timestamp" - User-Agent:
AnyLog/1.23 - destination:
network
- command:
- Validate the data and continue
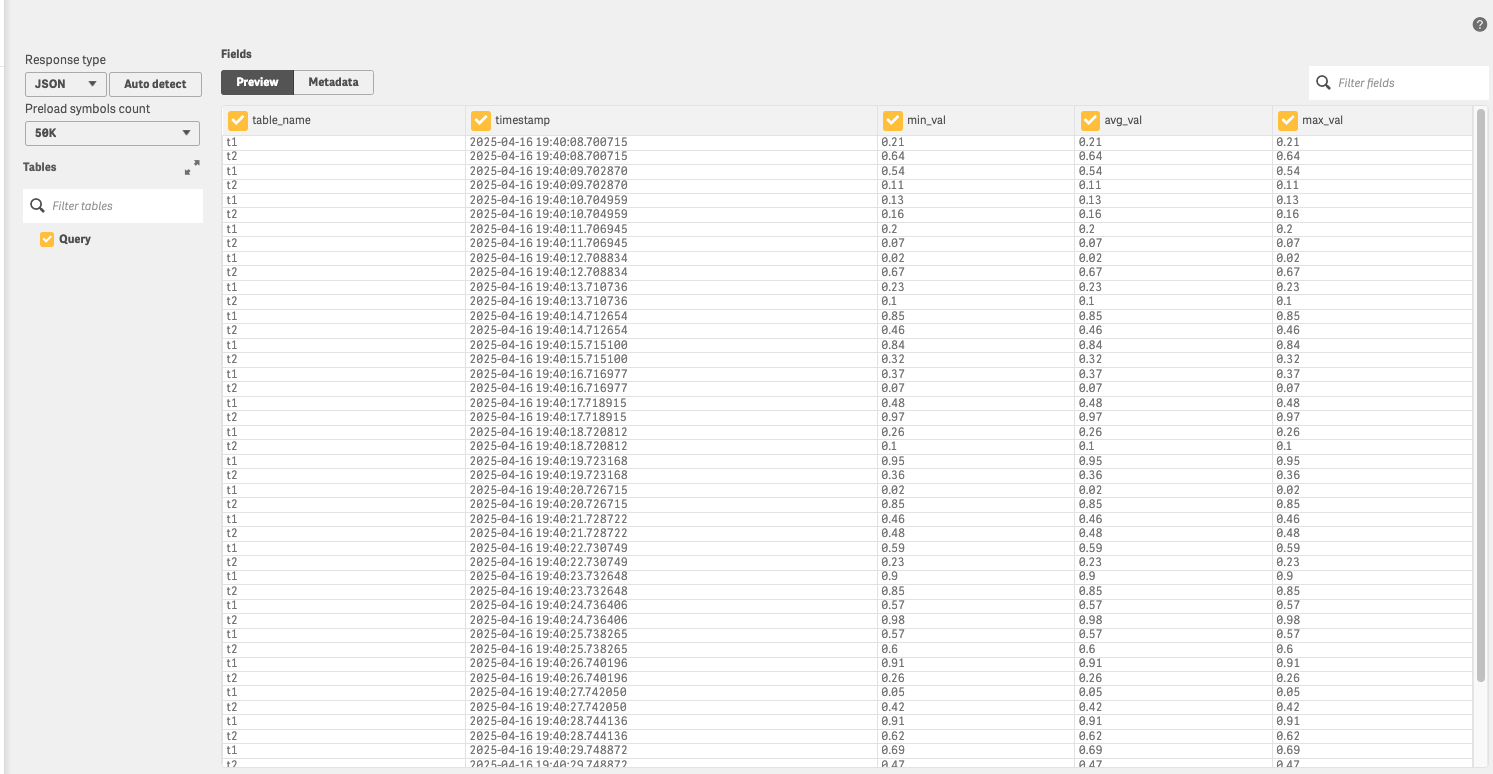
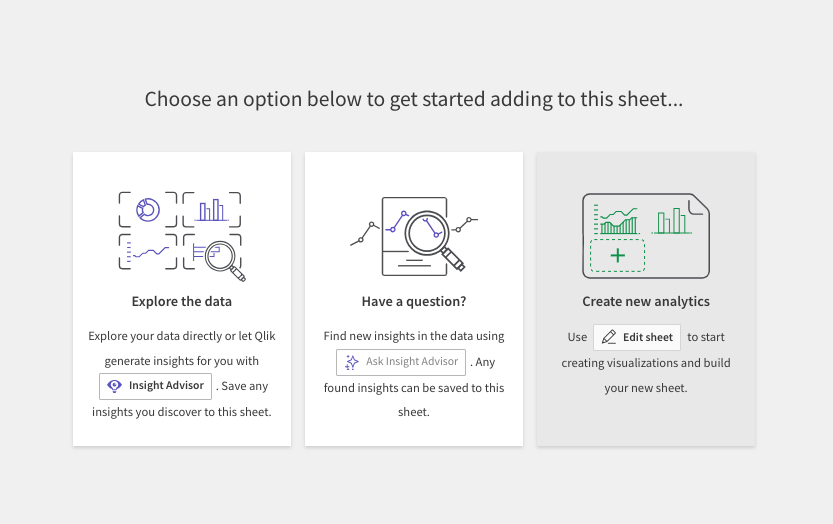
- Create a new Analytics
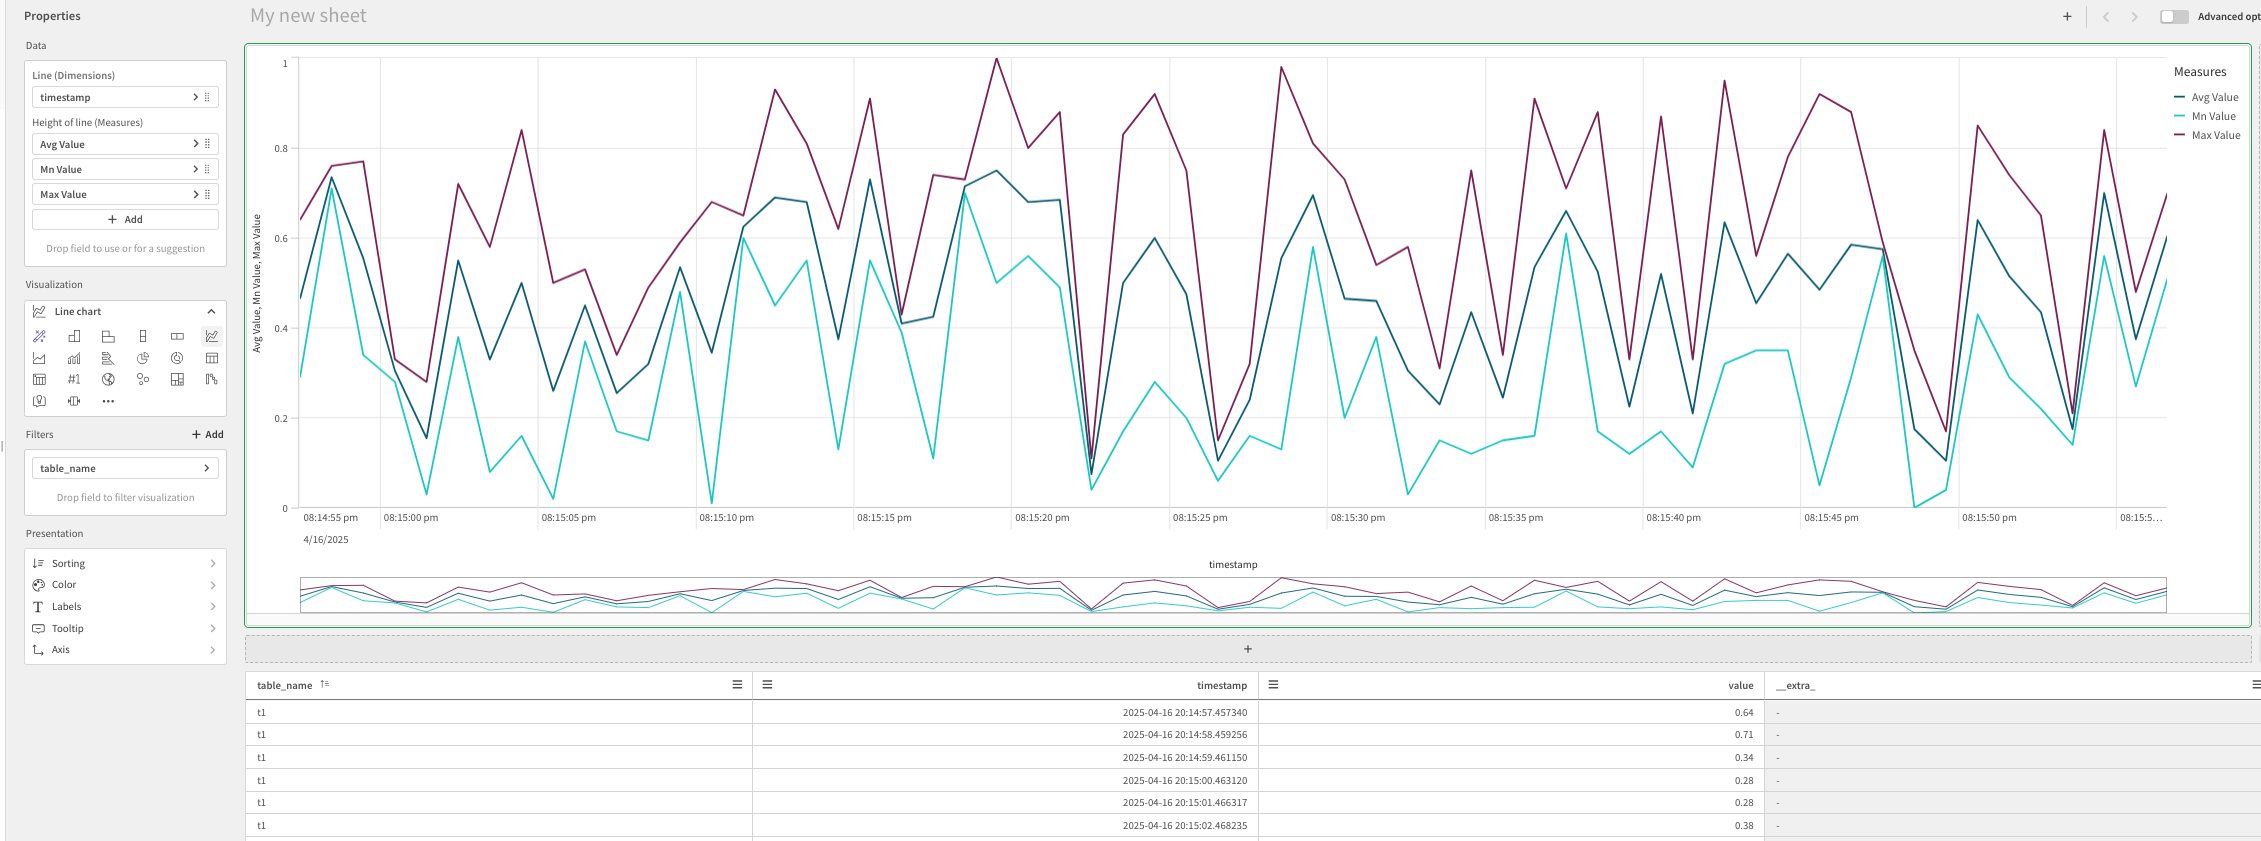
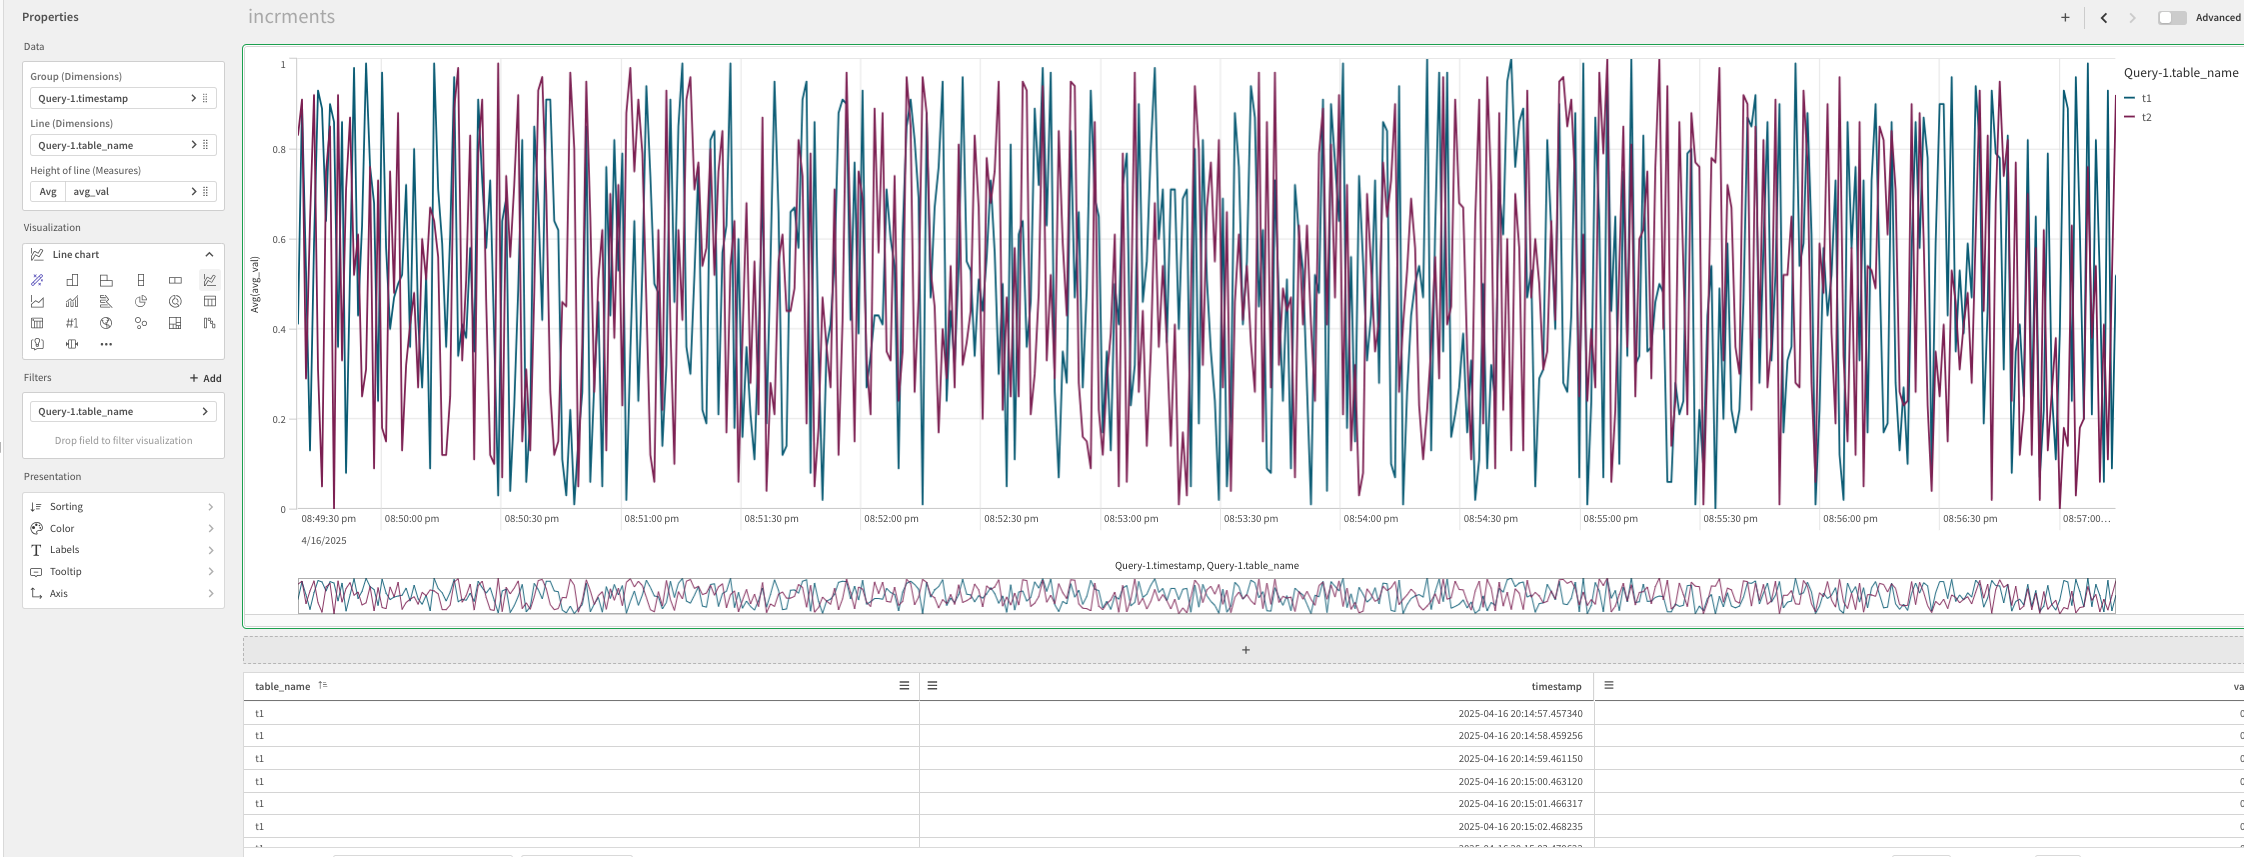
- Create a graph based on the given Dimensions
Period Data
The period function finds the first occurrence of data before or at a specified date (and if a filter-criteria is specified, the occurrence needs to satisfy the filter-criteria) and considers the readings in a period of time which is measured by the type of the time interval (Minutes, Hours, Days, Weeks, Months or Years) and the number of units of the time interval (i.e. 3 days - whereas time-interval is day and unit is 3).
- For the URL specify the REST IP and port of the node to send the request against
- In the headers section add the following params:
- command:
sql nov format=json and stat=false and include=(t2) and extend=(@table_name) "select timestamp, value from t1 where period(minute, 1, now(), timestamp) order by timestamp" - User-Agent:
AnyLog/1.23 - destination:
network
- command:
- Validate the data and continue
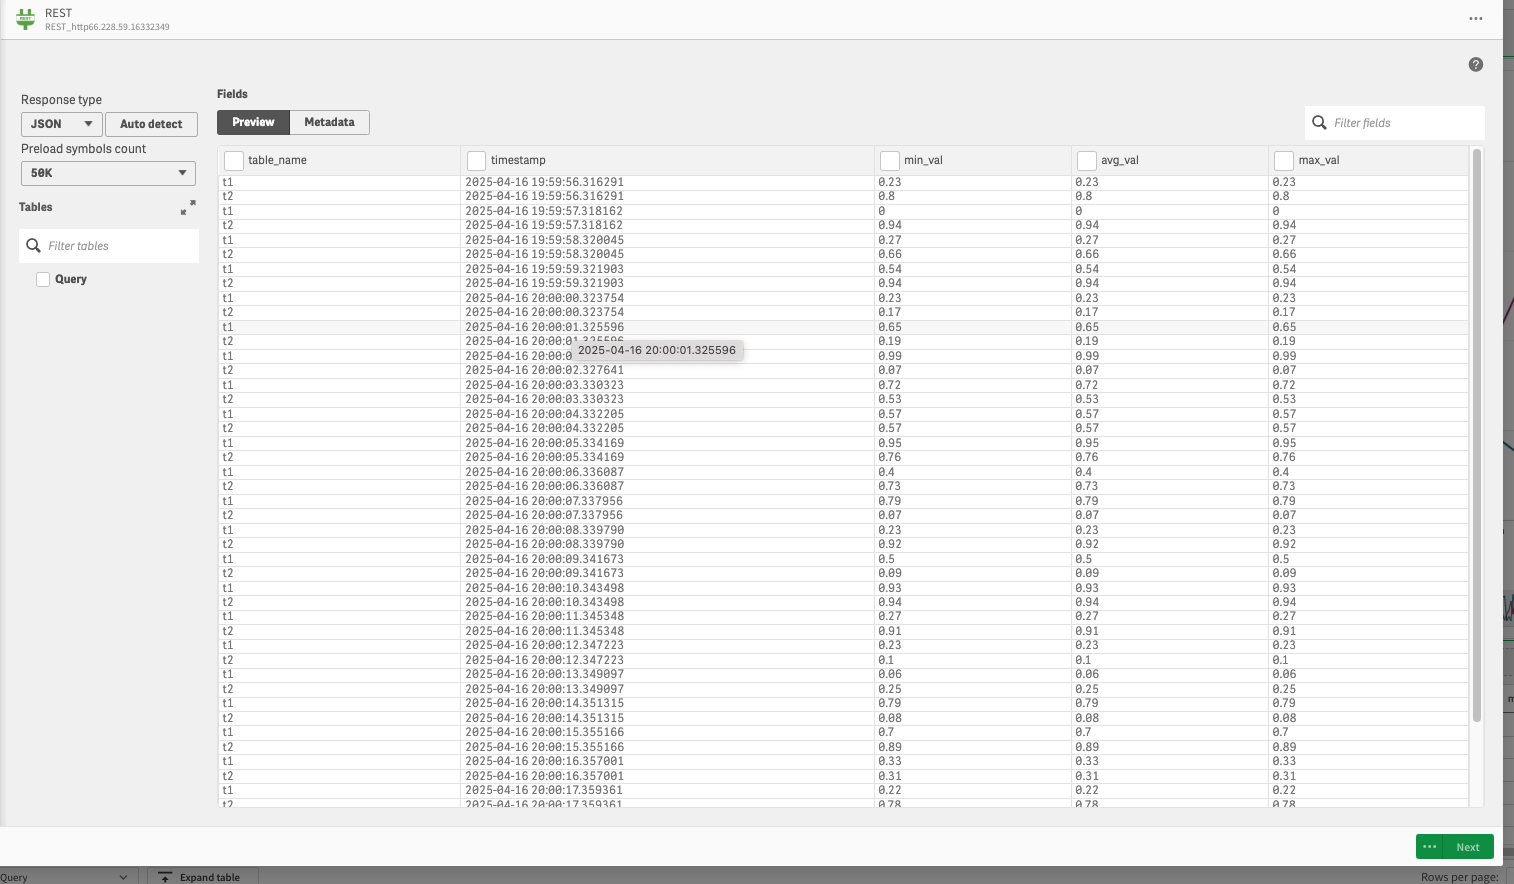
- Create a new Analytics
- Create a graph based on the given Dimensions