Google Drive
Connect AnyLog to Google Sheets/Drive via the Two Minute Reports add-on to pull query results into reports and graphs.
To extract data from AnyLog into Google Drive we recommend using a tool called Two Minute Reports which provides the ability to import data via REST, Database, Social Media and other SEO services.
Install
-
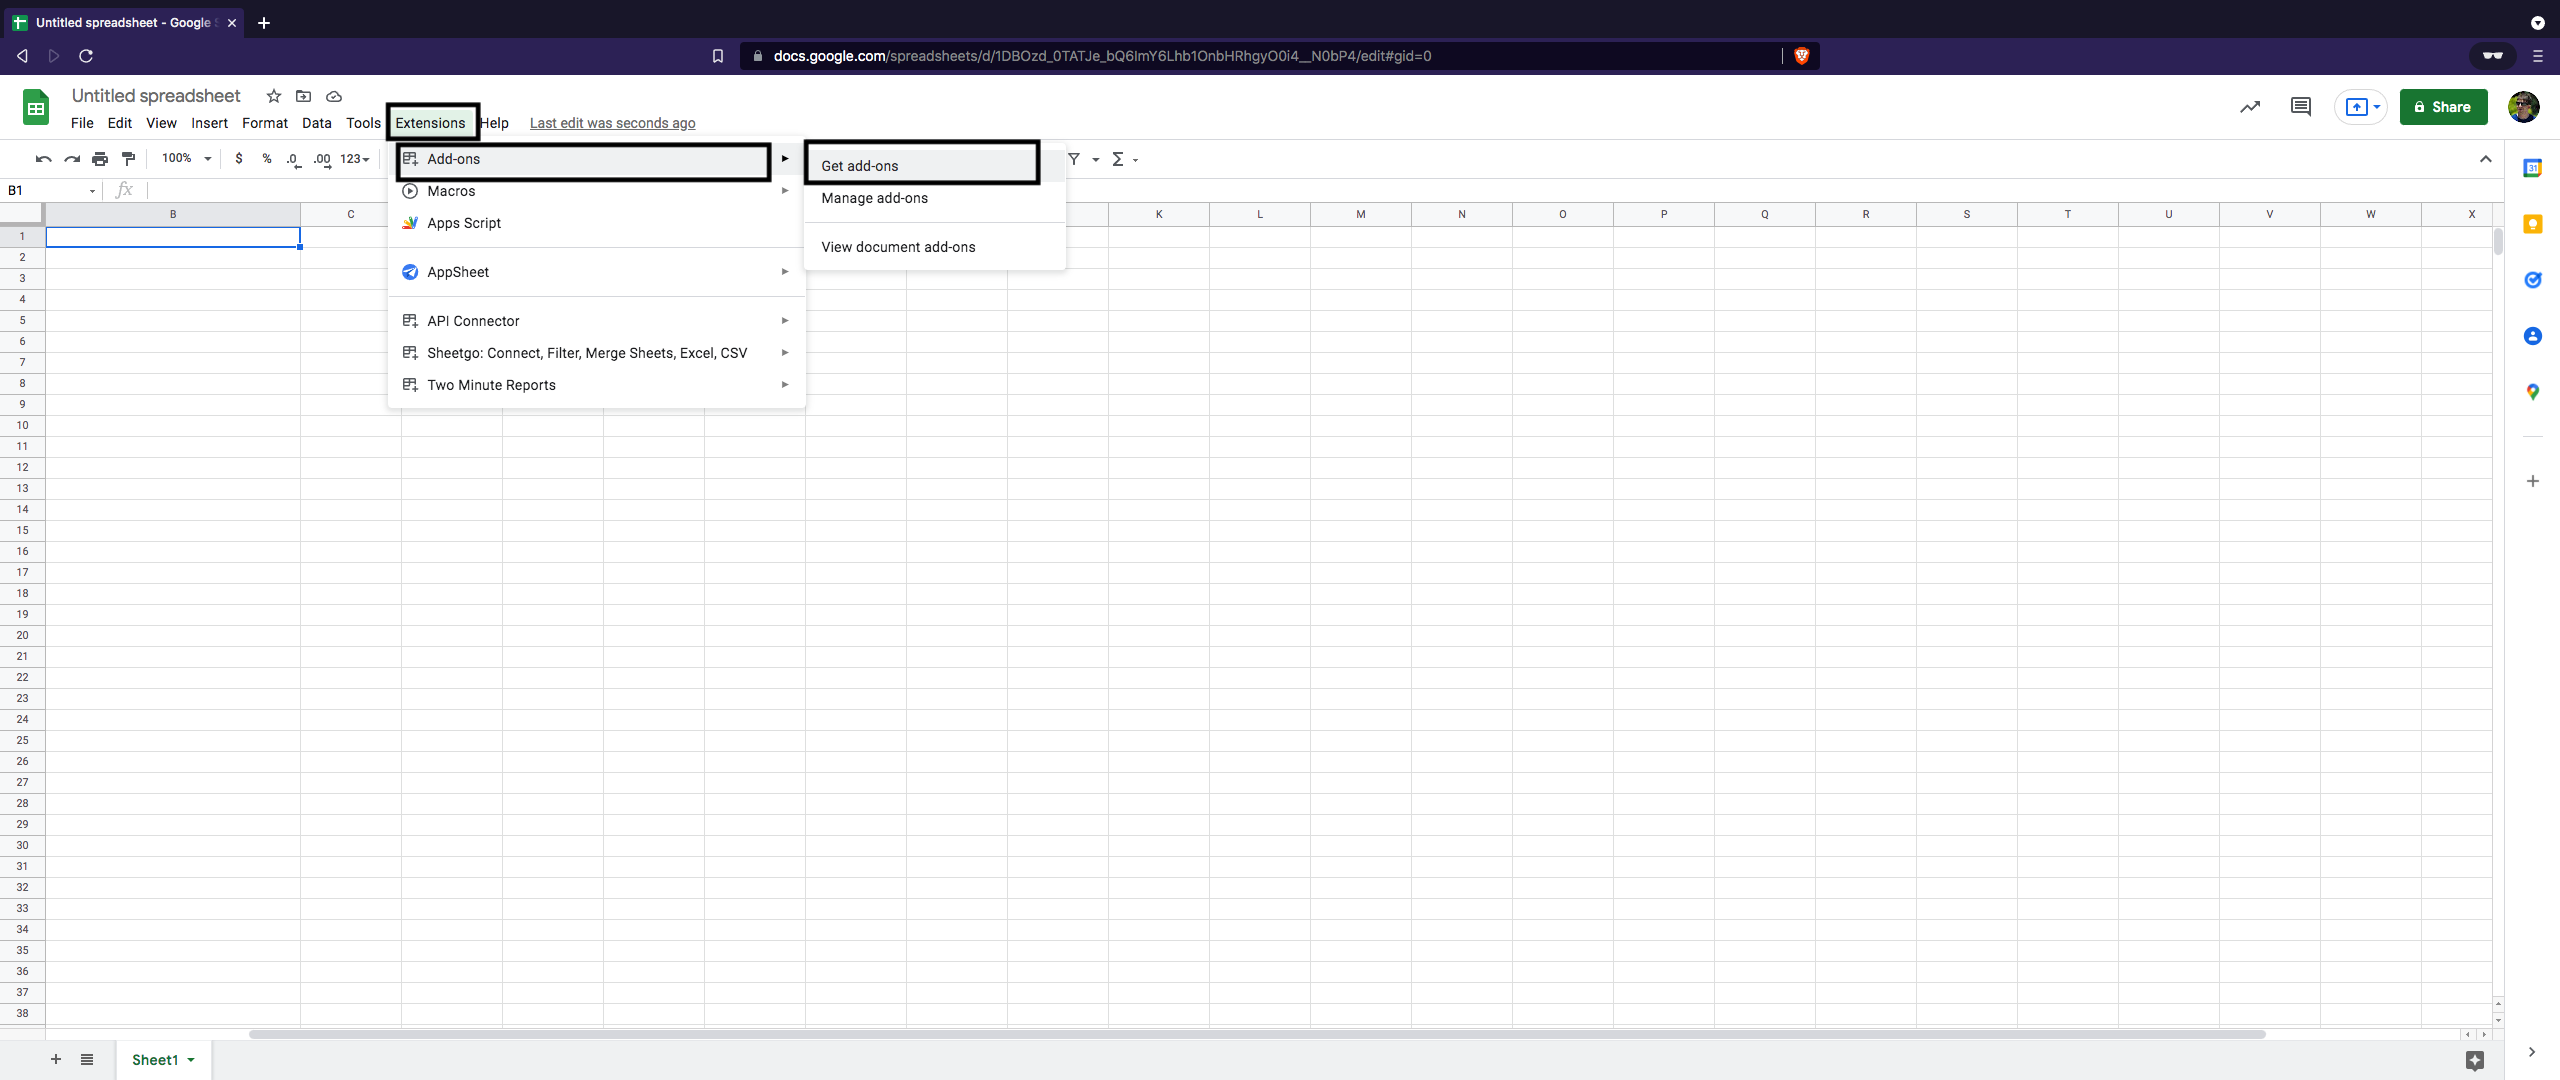
Under Extensions goto Add-ons → Get add-ons
-
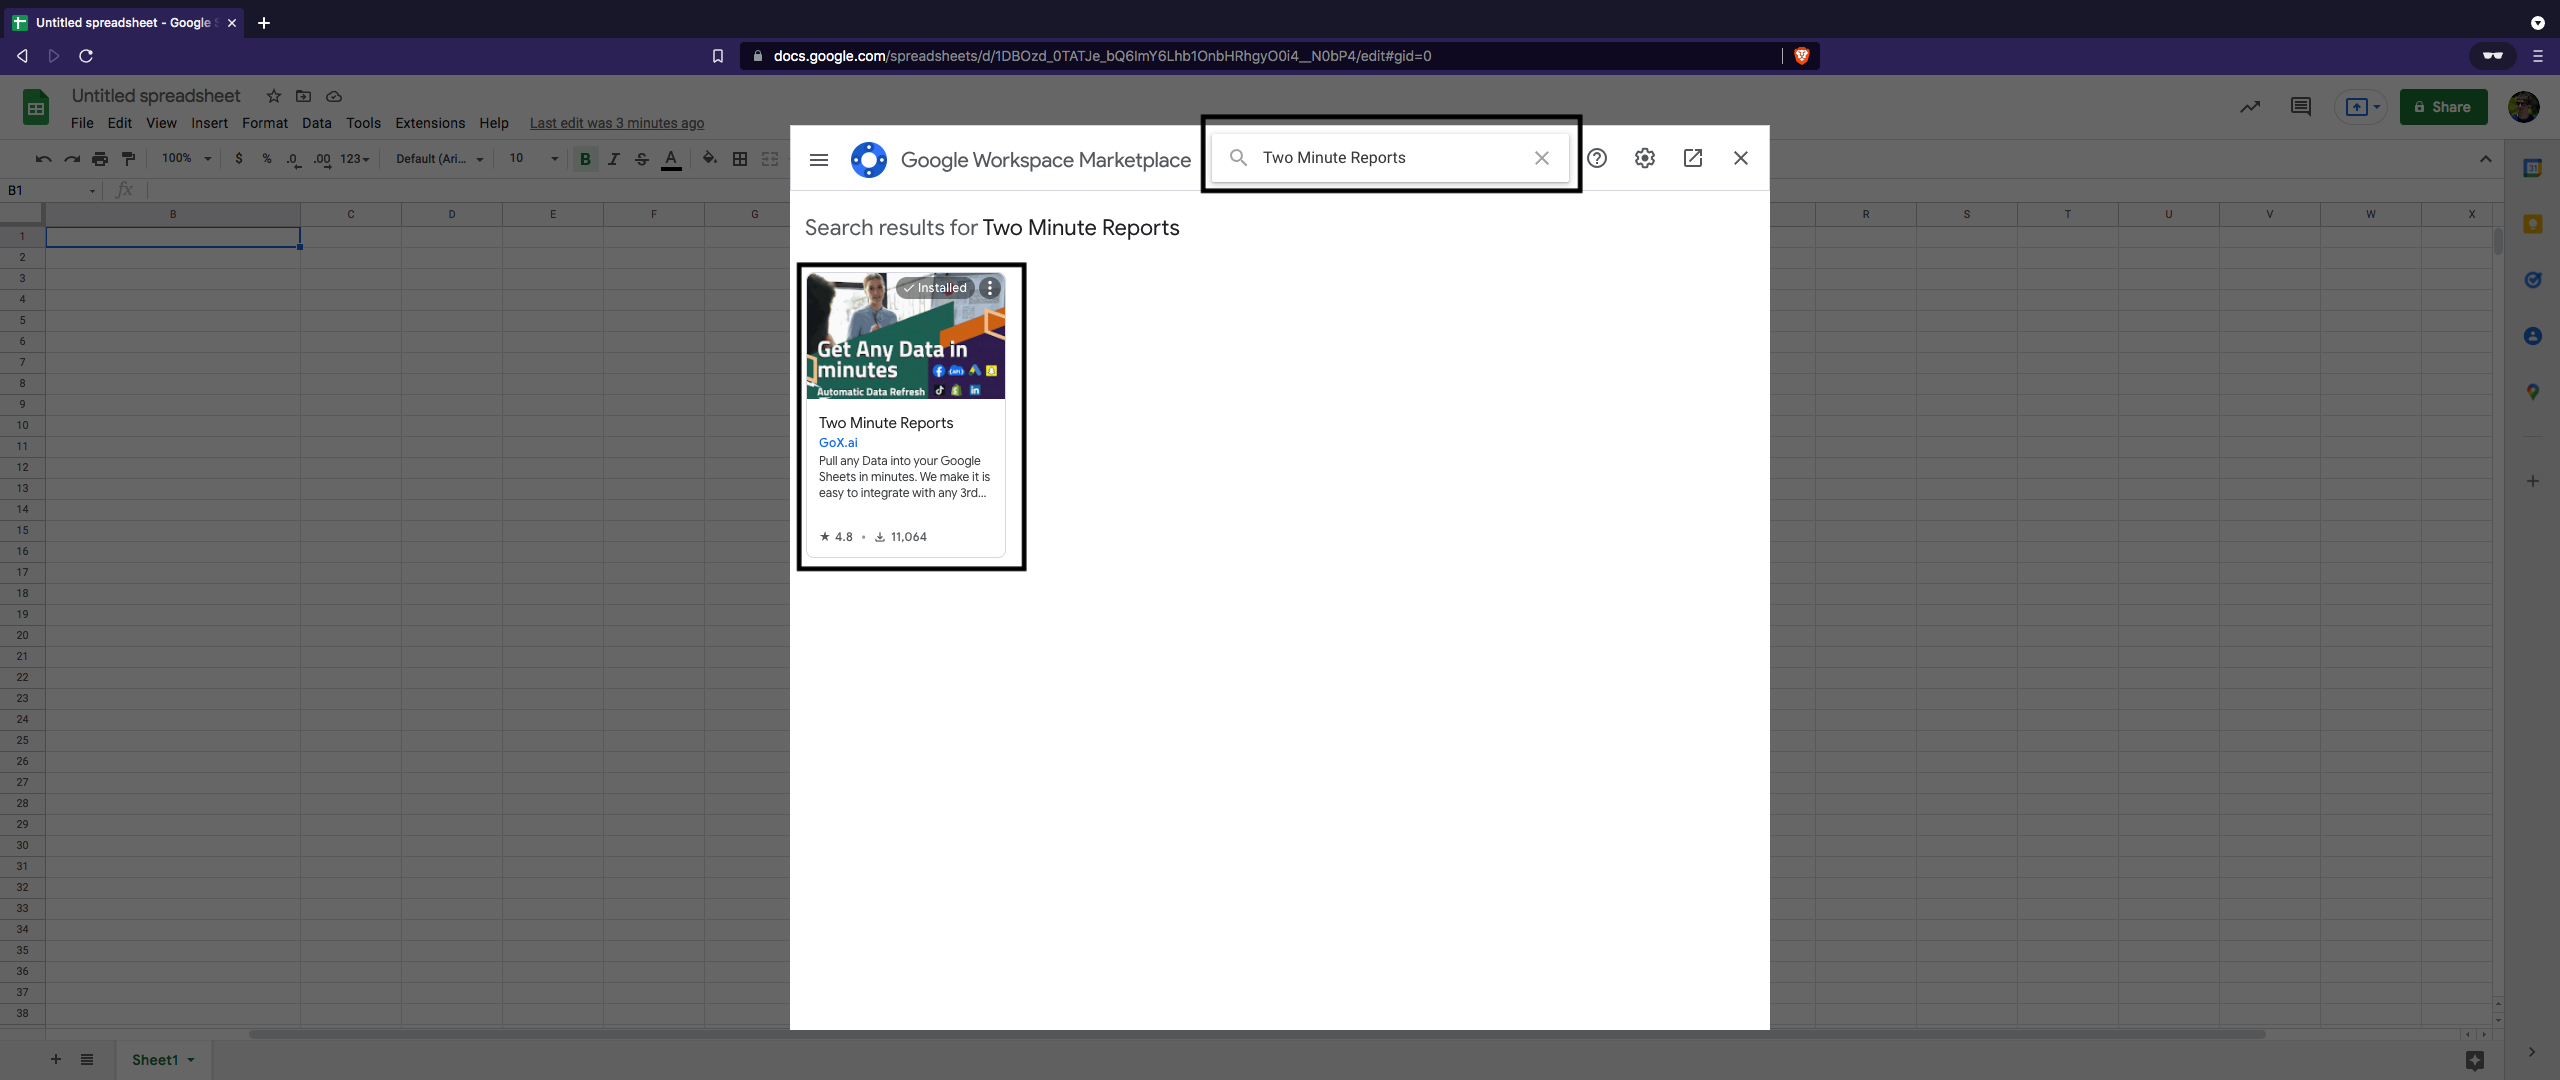
In the search bar look for “Two Minute Reports” & double click it
-
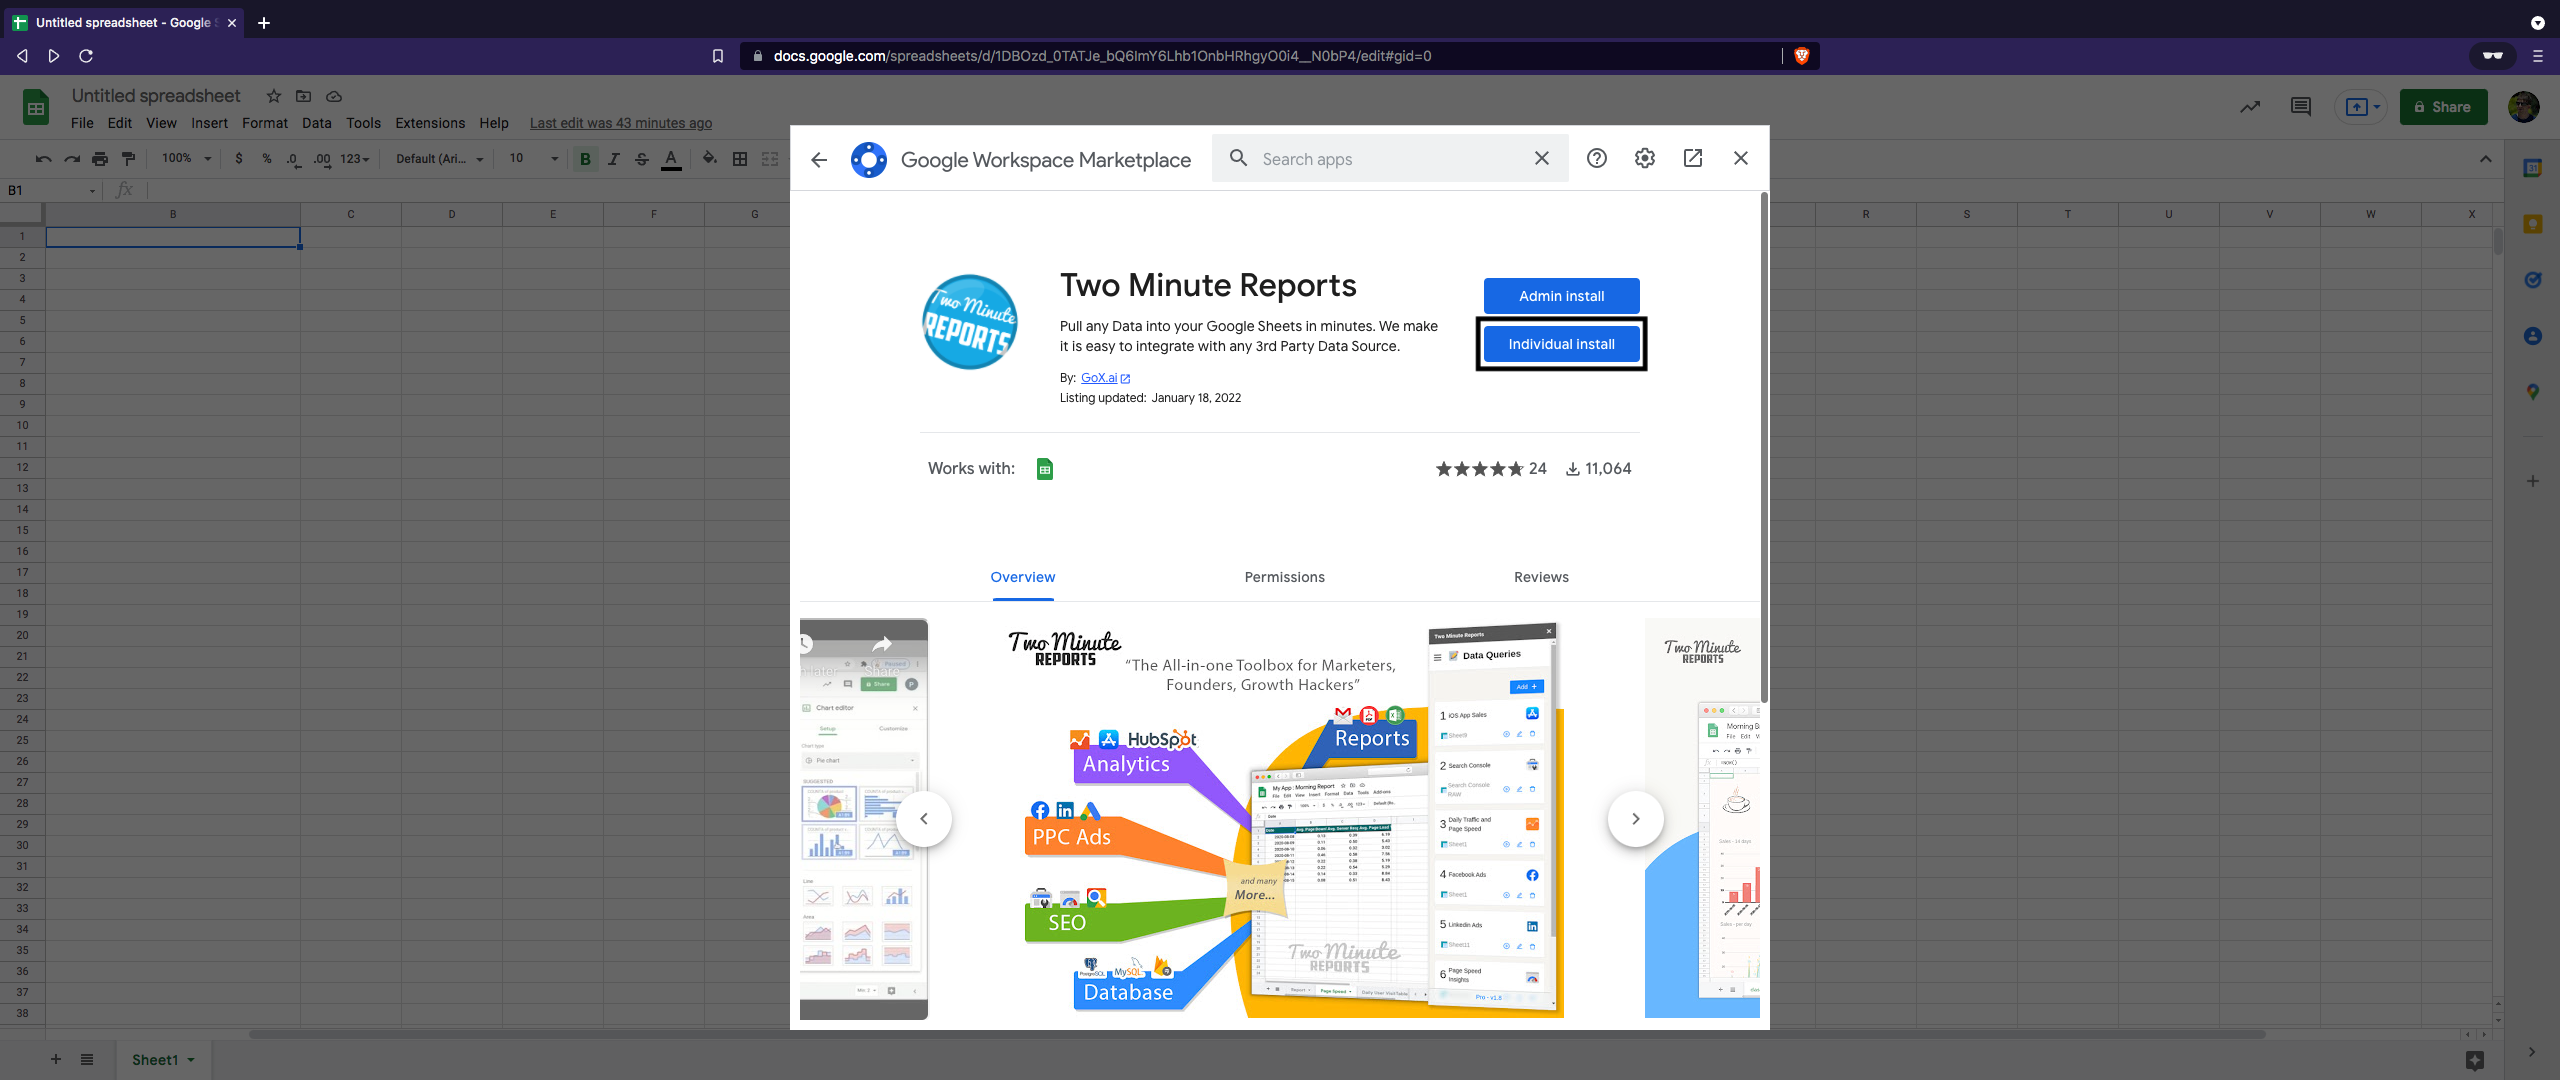
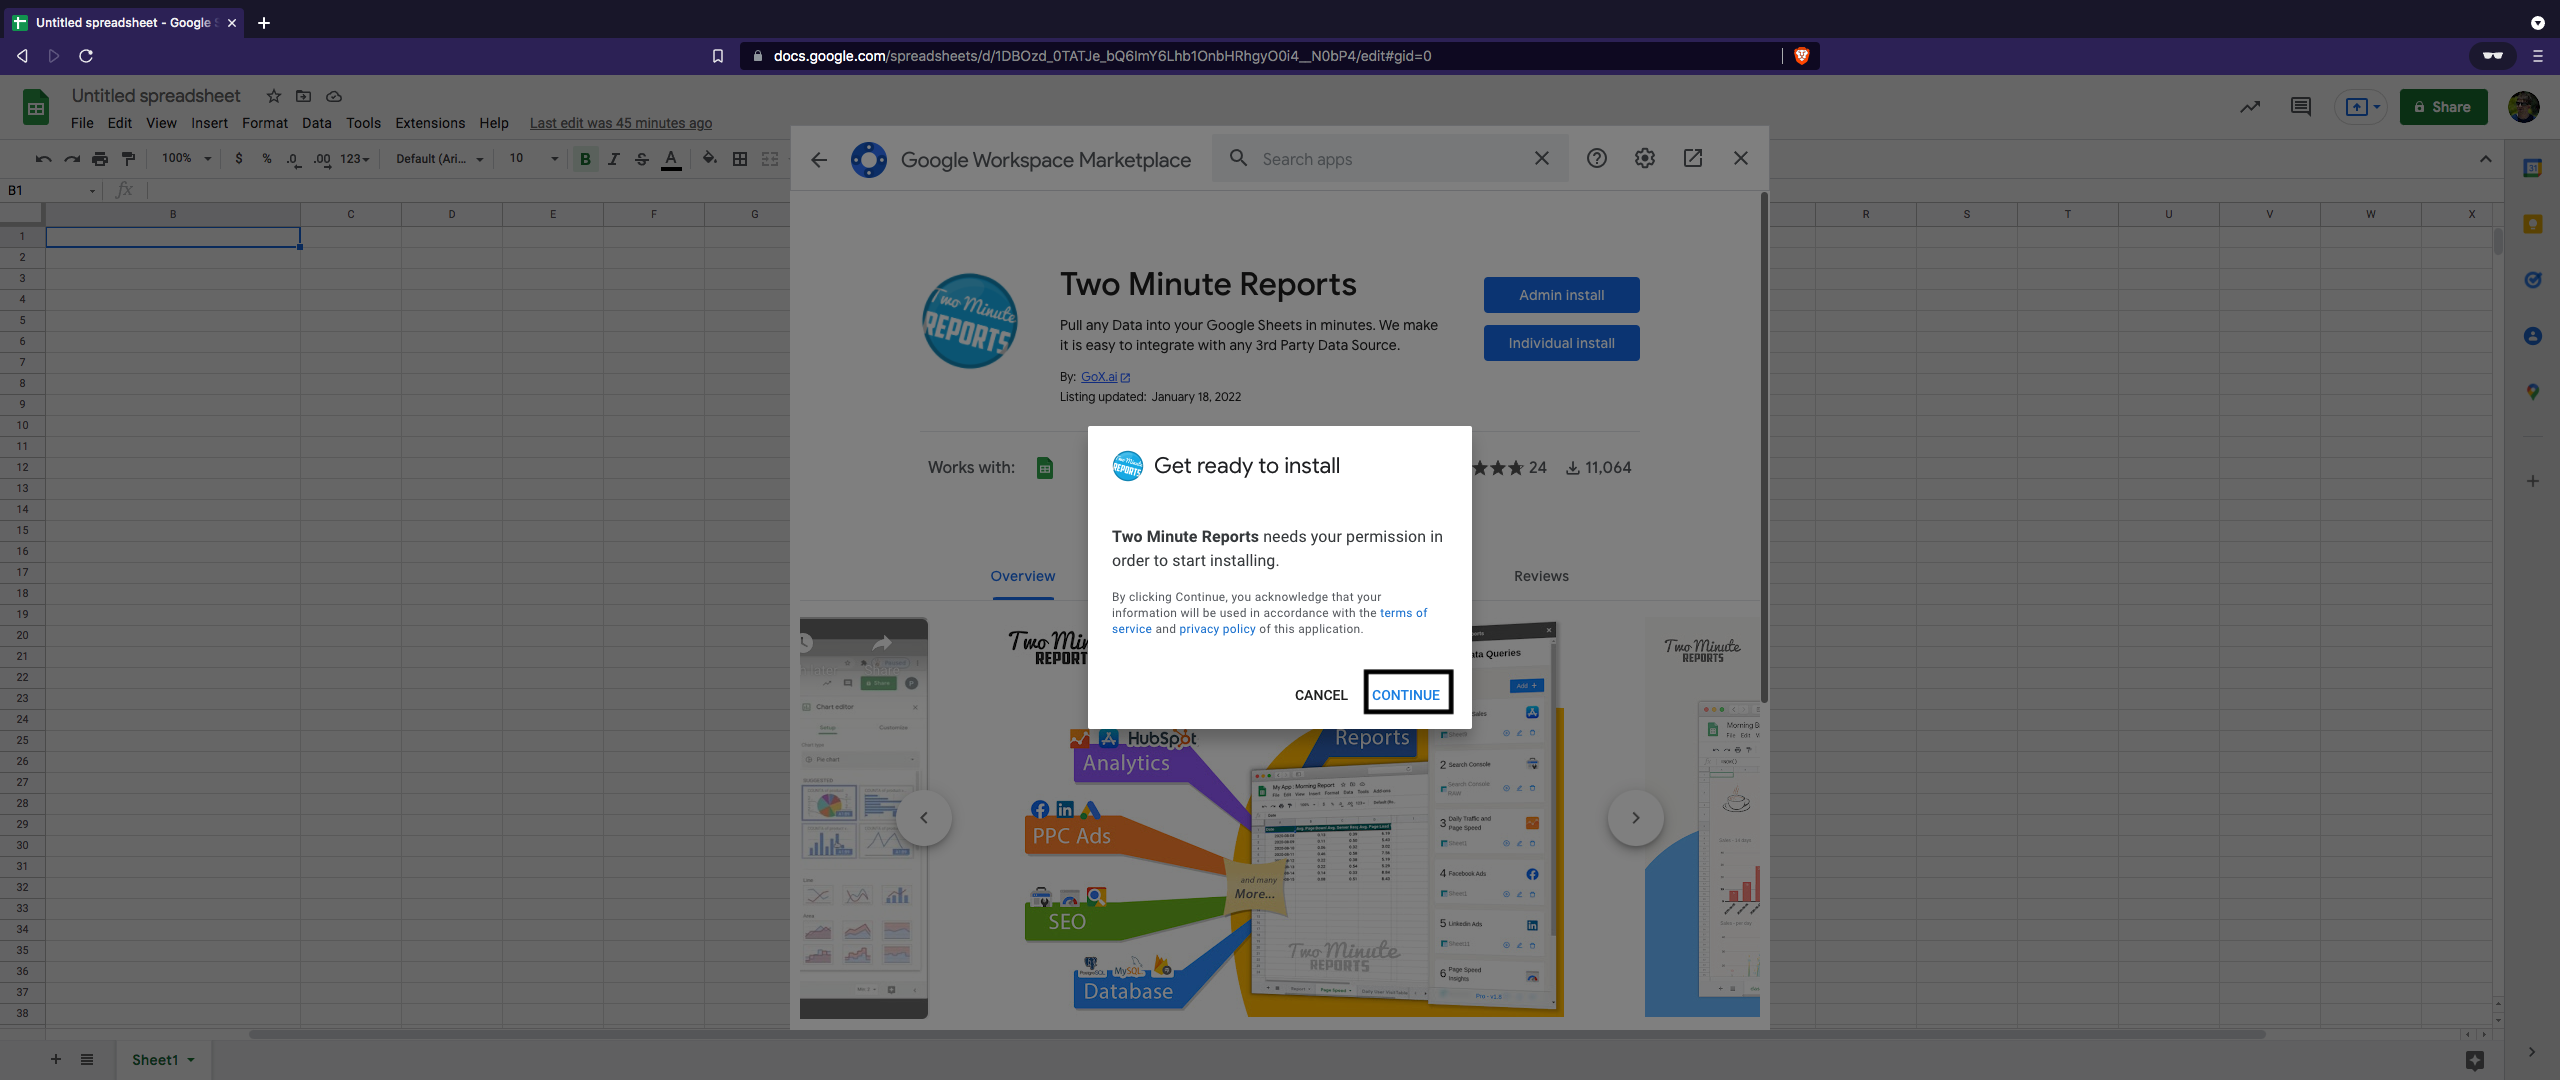
Install the add-on to your Google Sheets & press “continue”
 |  |
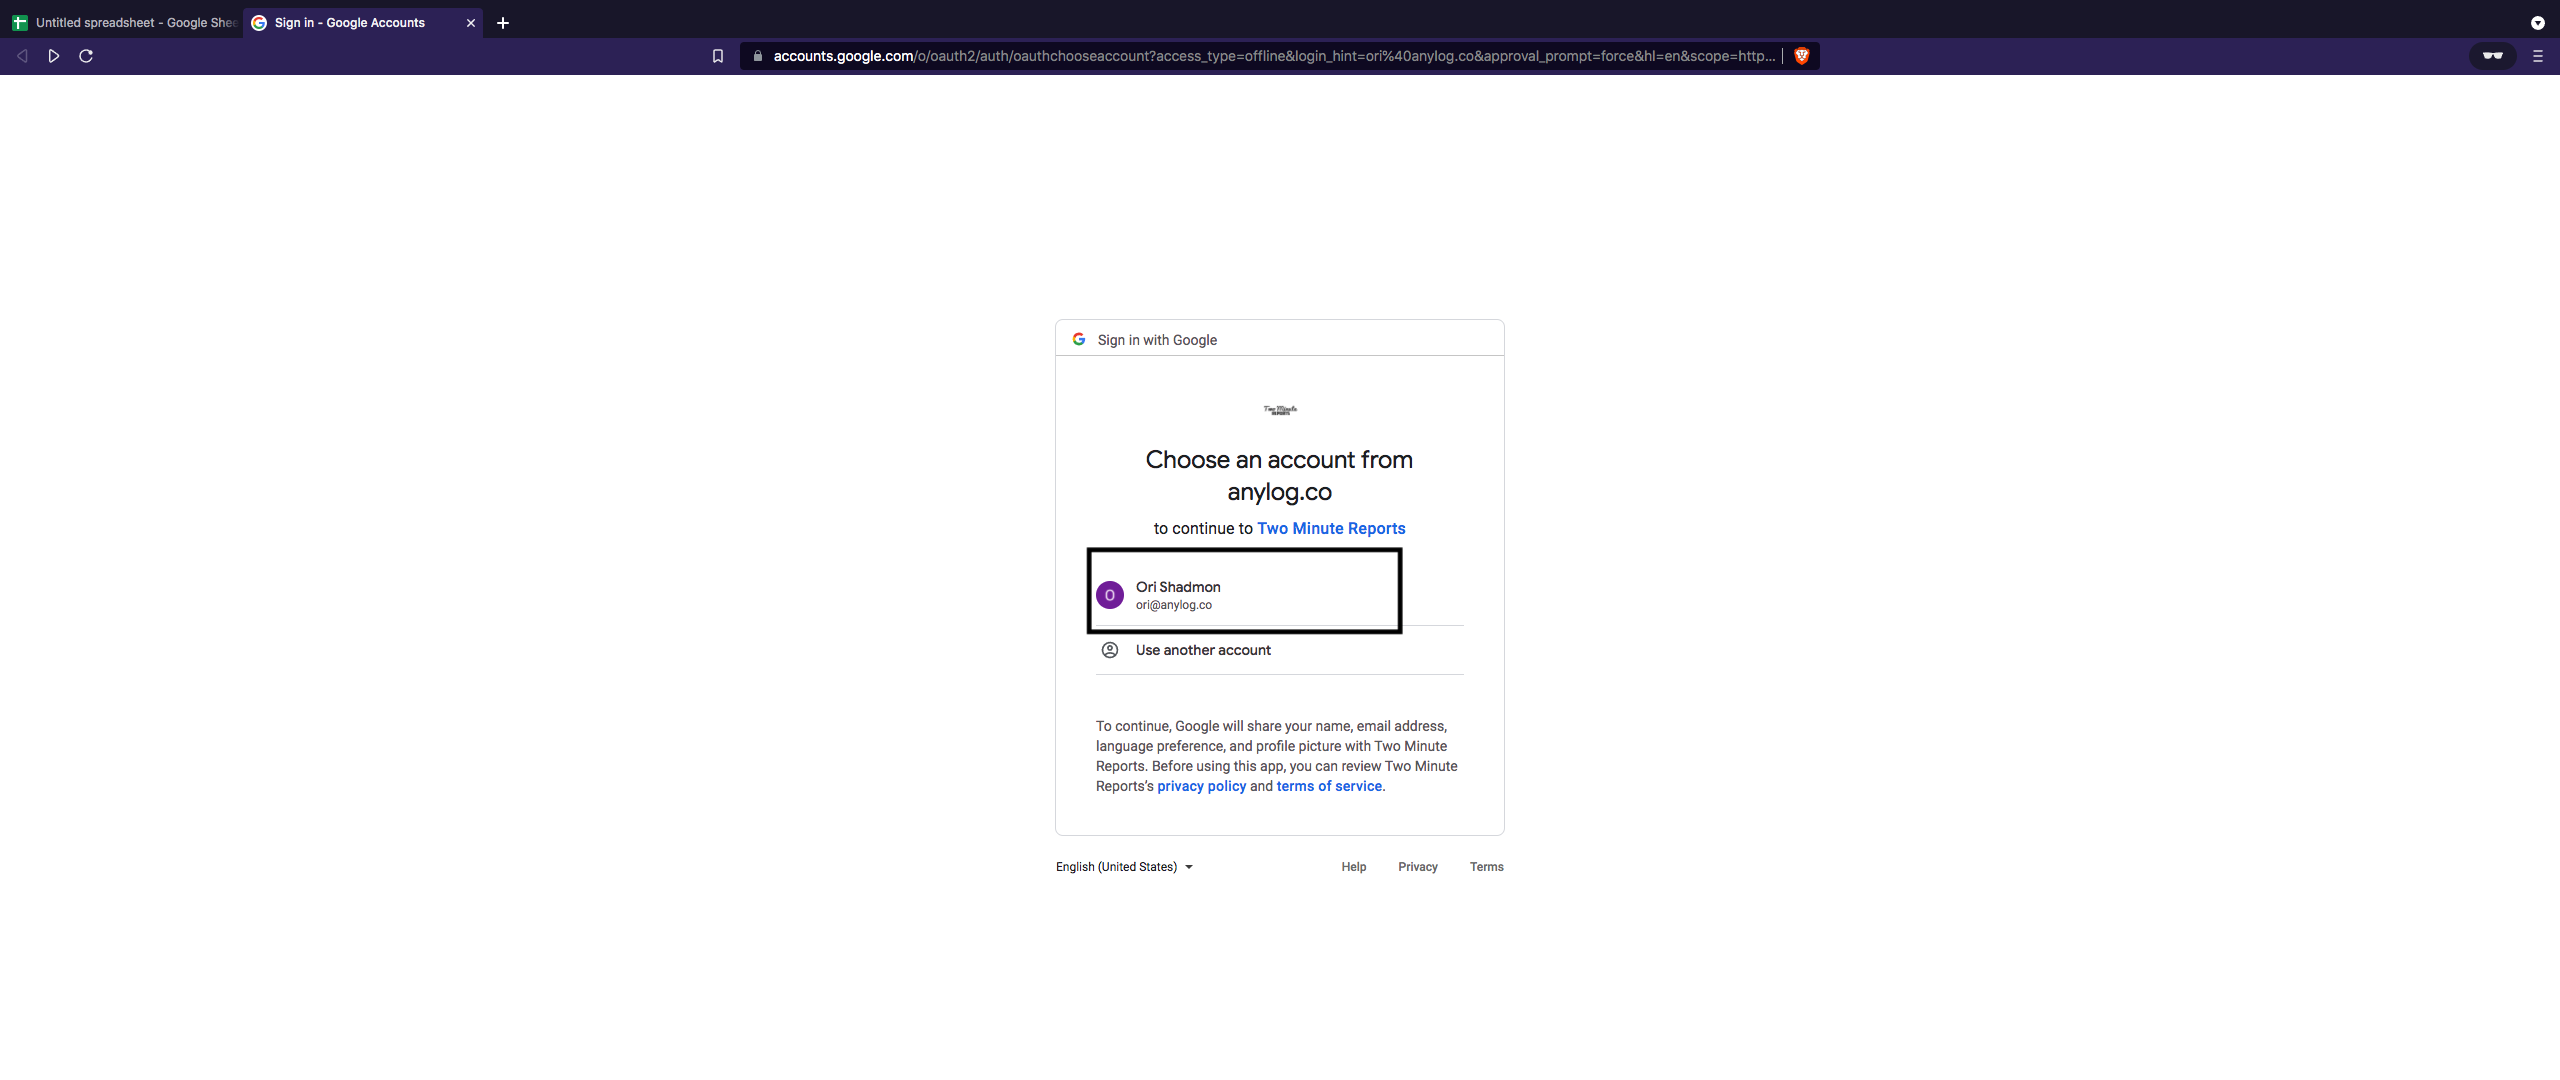
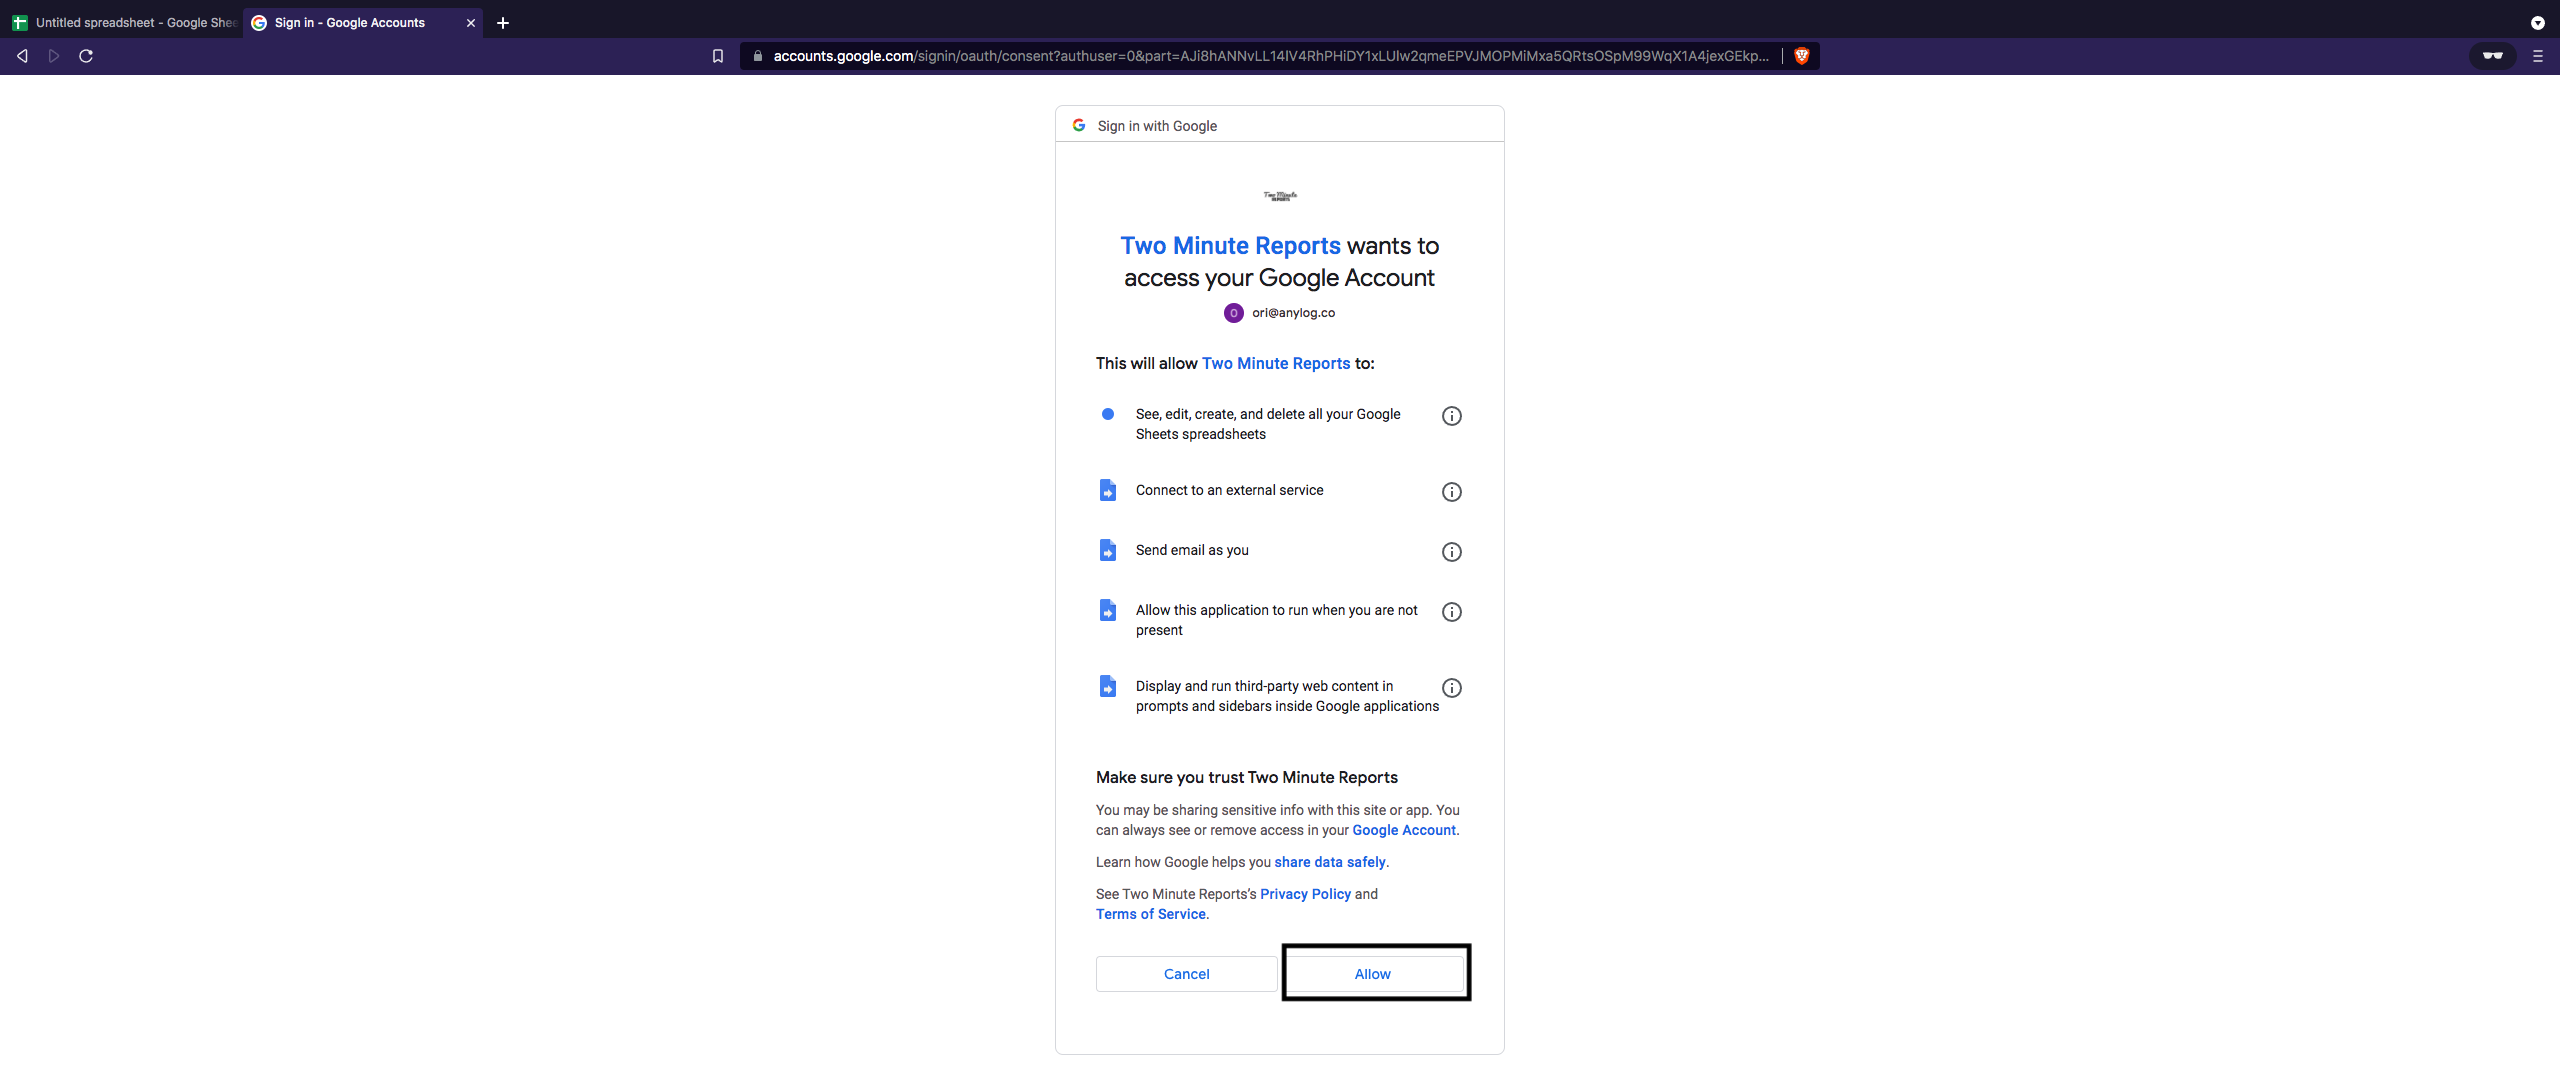
- Google Requires users to confirm - click on the user you’d like to install the application on & press “Allow”
 |  |
Executing REST Request
-
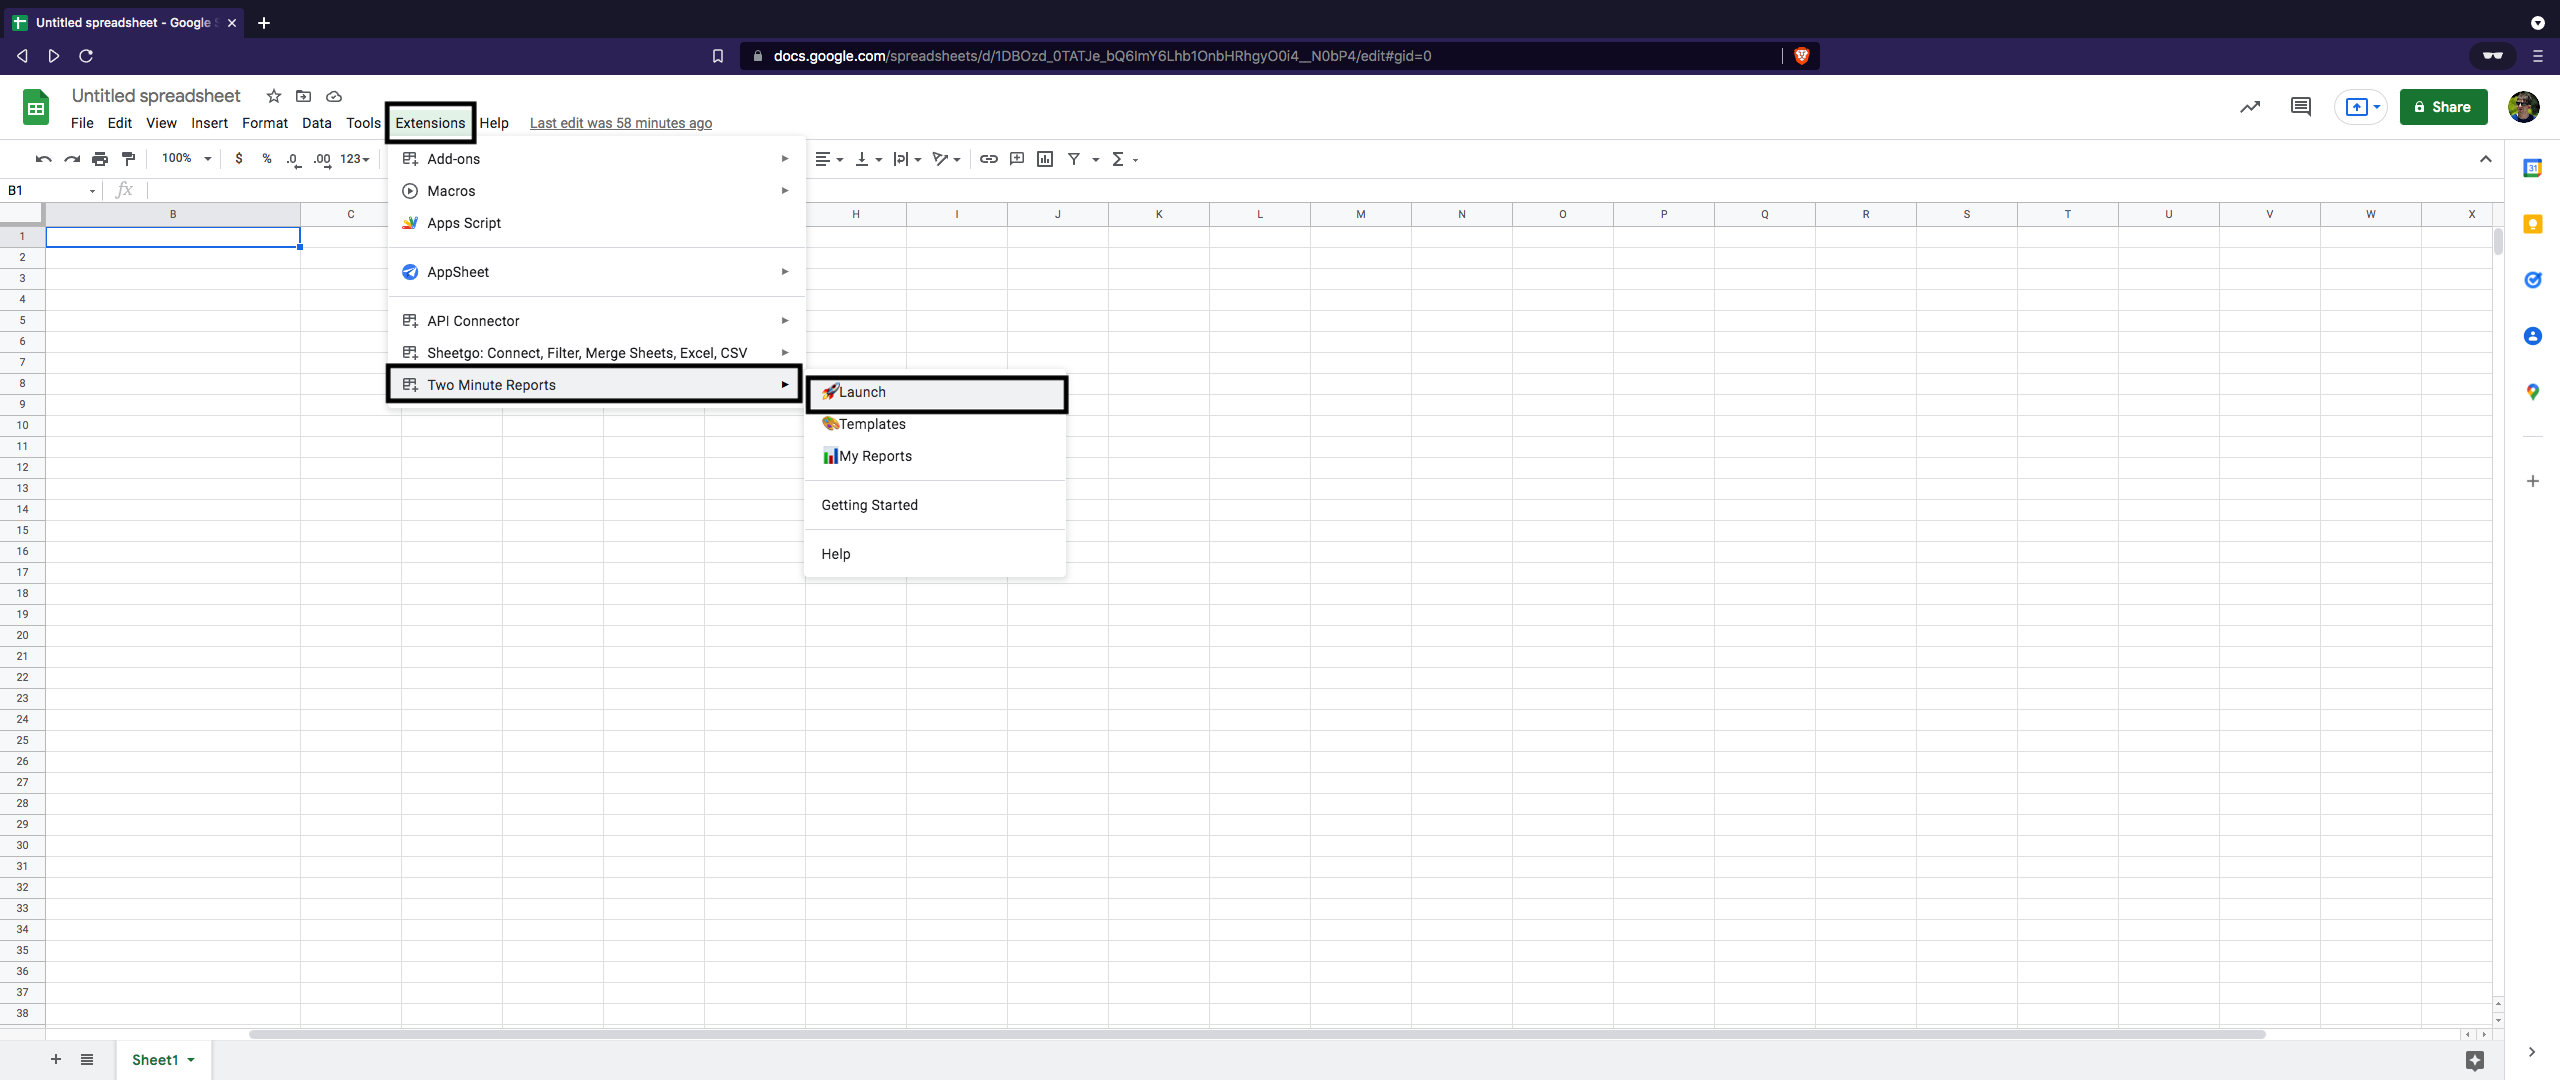
Once that’s completed launch Two Minute Reports: Extensions → Two Minute_Reports → Launch
 Note: Two Minute Reports works best when only a single account is logged in.
 -
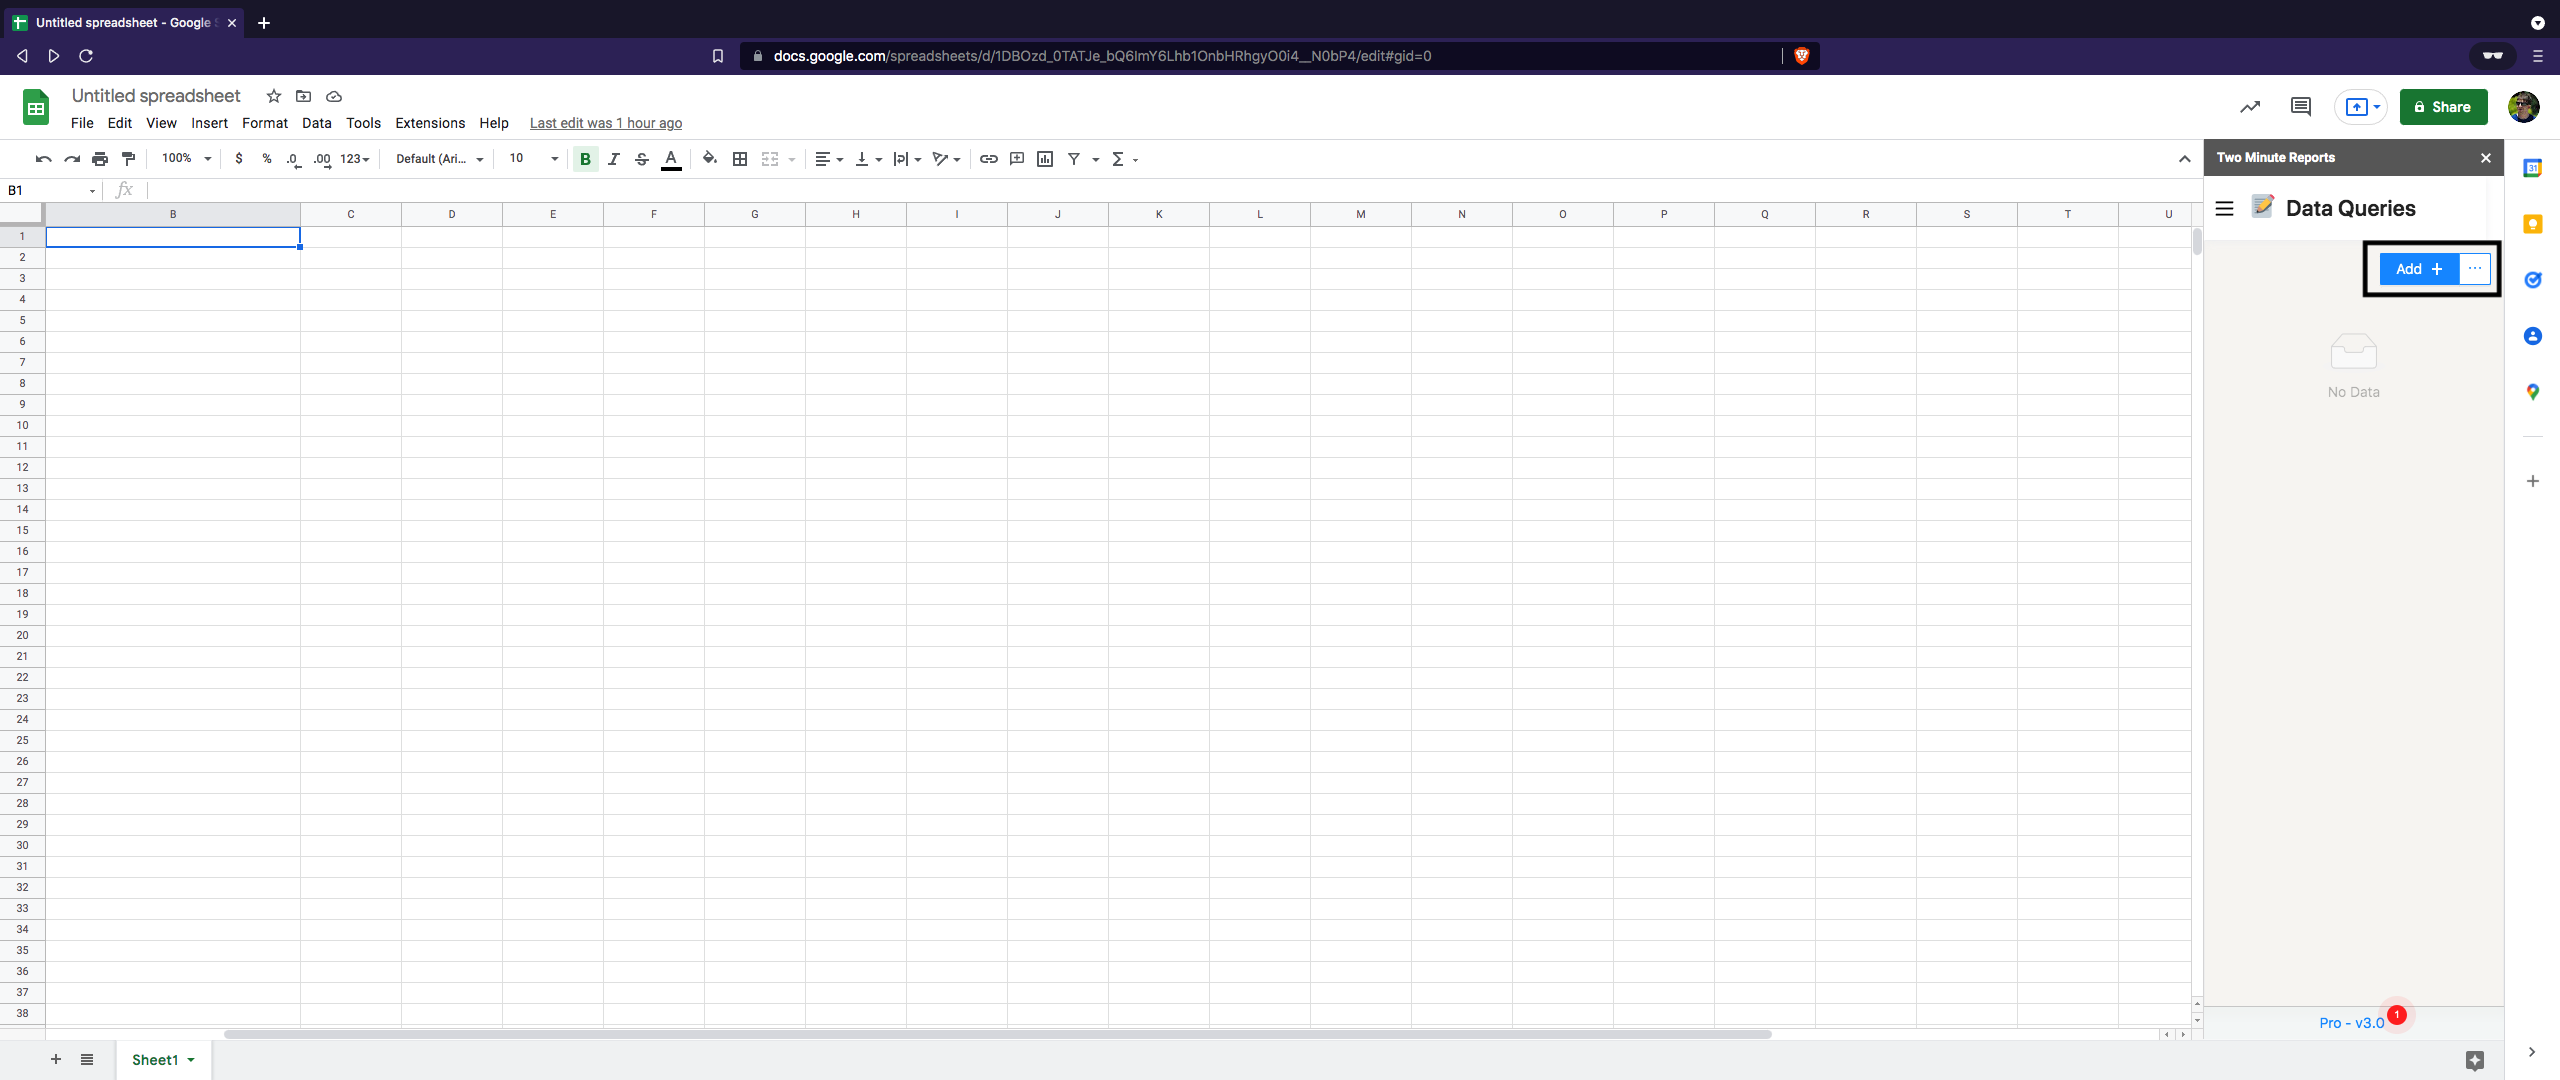
Press “Add+” to connect to a new REST connection
-
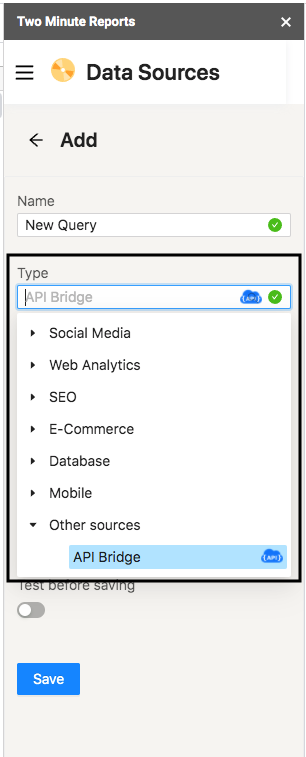
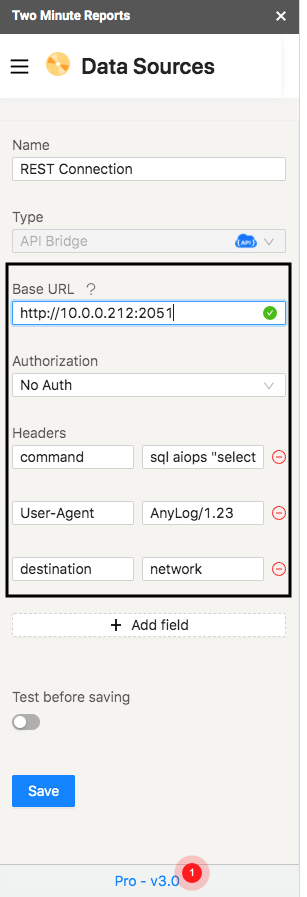
Under Data Source set the Type to API Bridge & Fill-out the form
Notice that for the complete form user should specifiy: Base URL, Authentication (if set) and headers.
For demo purposes, I’m using a query that consists of and returns the data as a list of JSON values without statistics:
sql aiops format=json:list and stat=false "select increments(hour, 1, timestamp), min(timestamp) as timestamp, min(value) as min_value, avg(value) as avg_value, max(value) as max_value from sic1001_mv where timestamp >= NOW() - 1 week"
 |  |
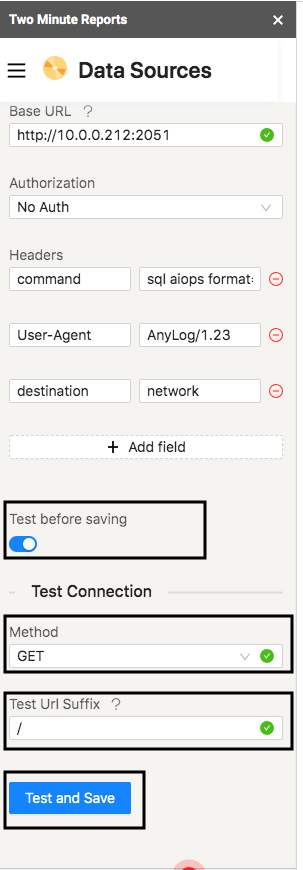
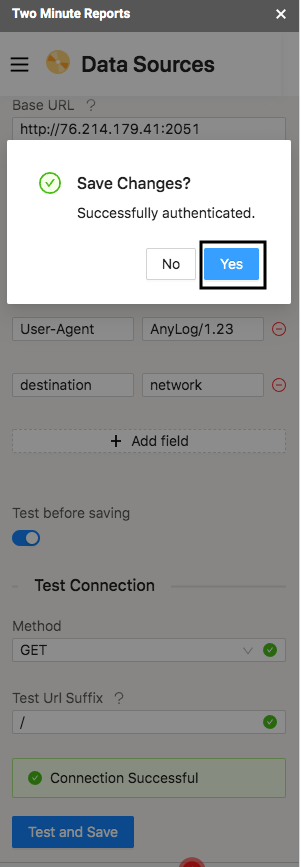
- Once the form is complete, test and save the changes - this will validate that the request is valid
 |  |
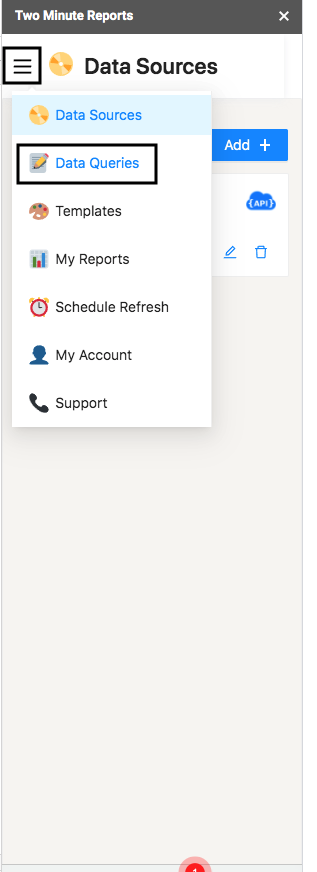
- In menu, goto Data Queries
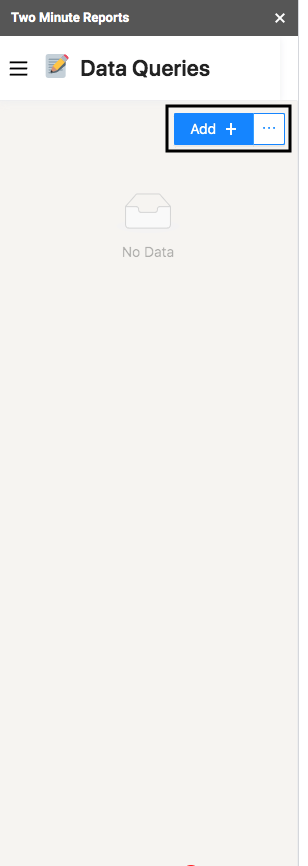
- Press Add+ to create a new Query Form
- Fill-out the form, setting Data Source to be the same as the the one created earlier & press “Run Query”
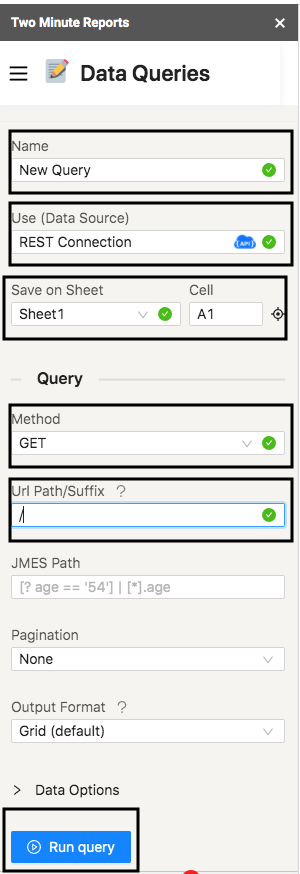
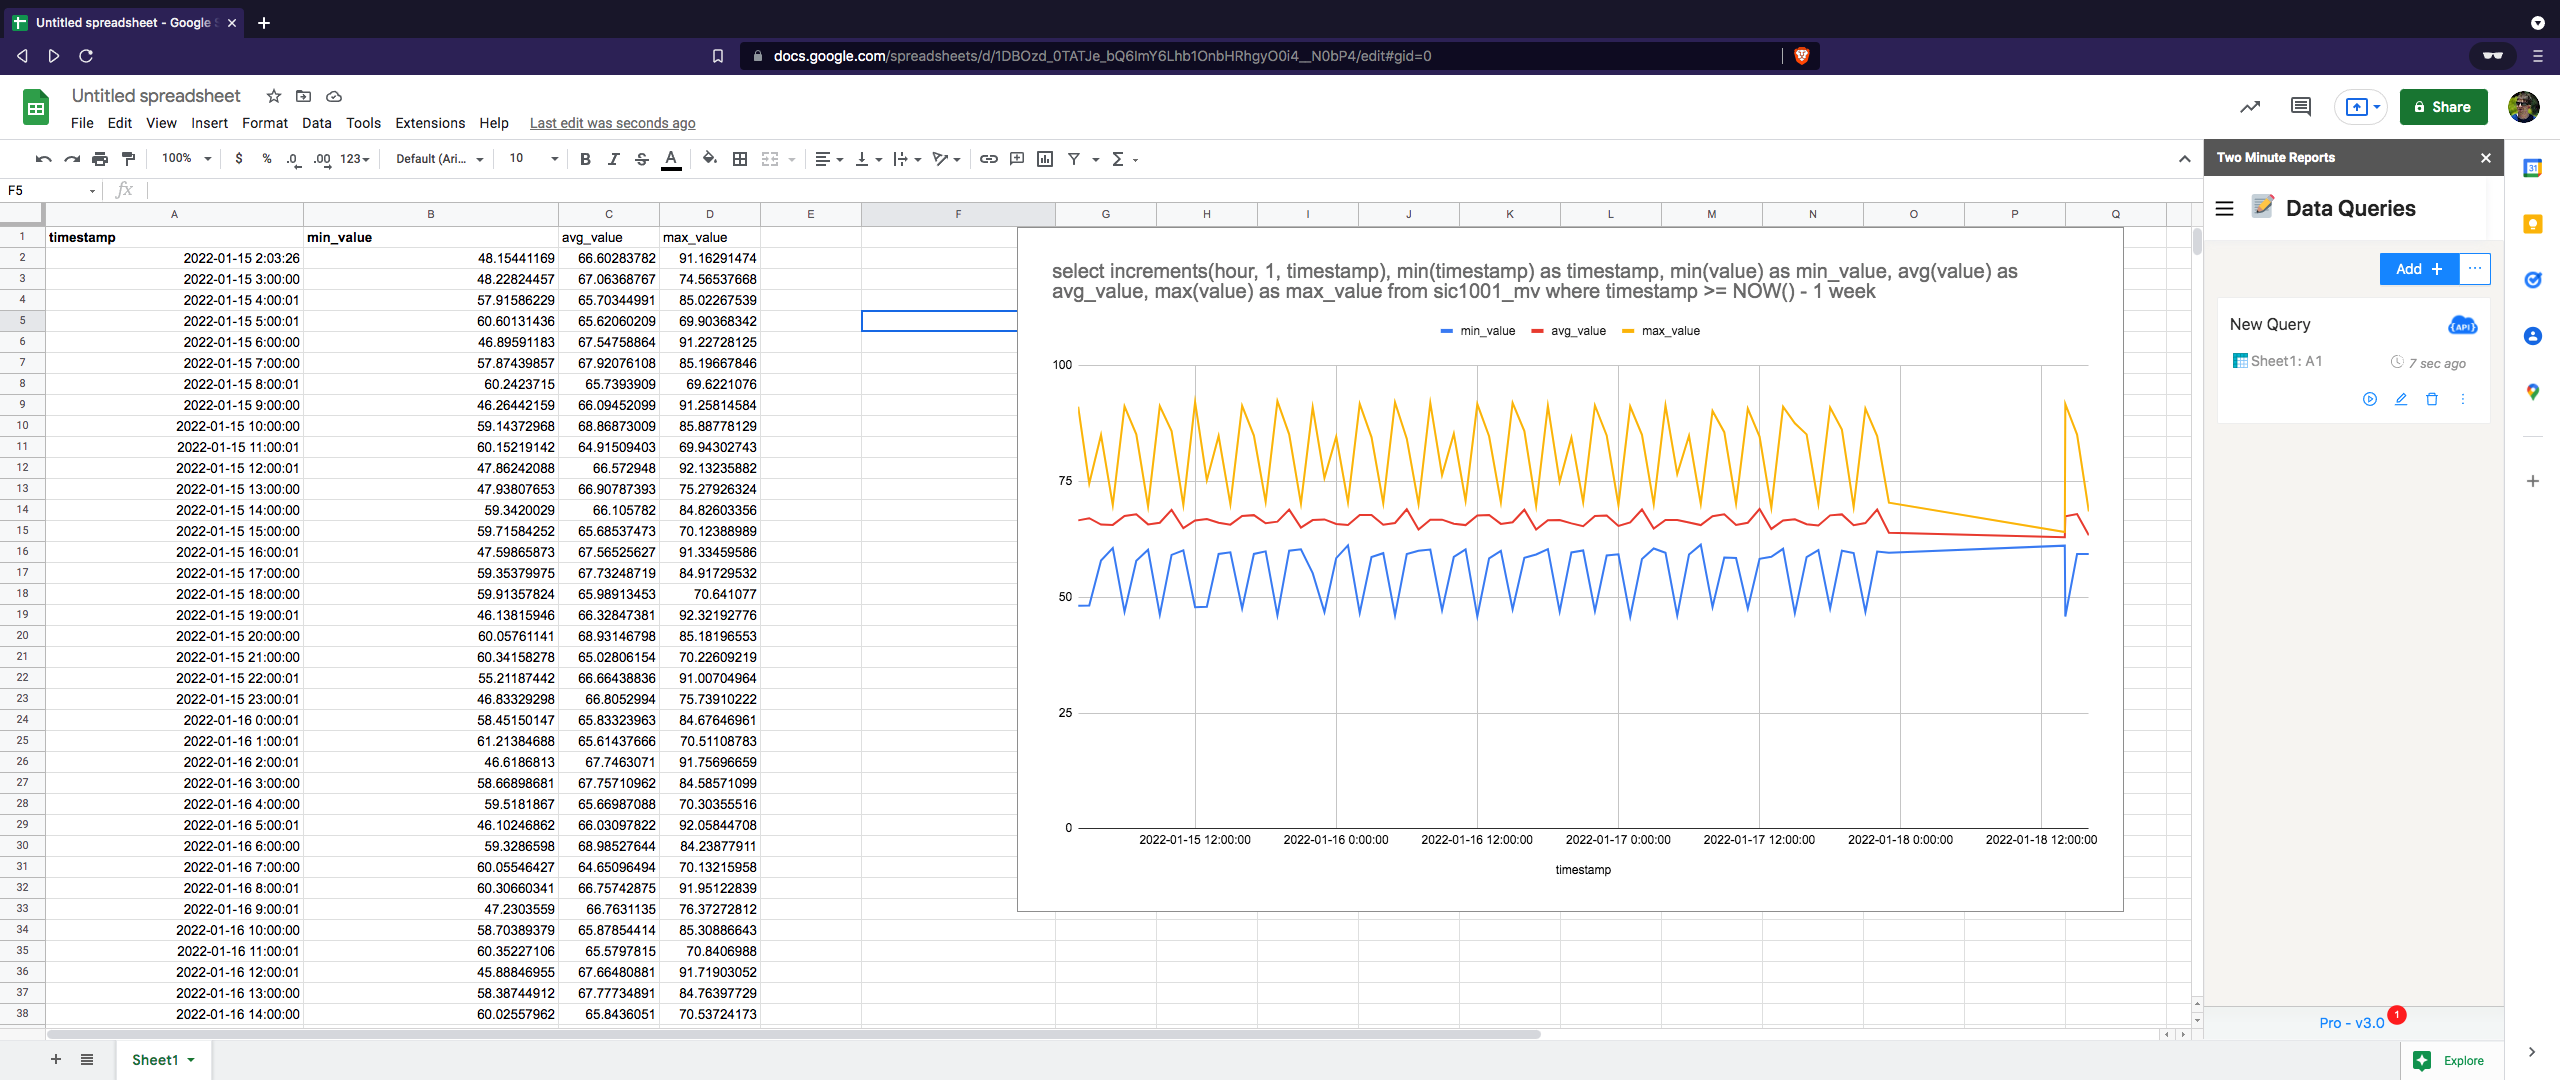
The steps mentioned above will ultimately result in a table similar to the one shown on the right of the image; with it users can generate images and graphs as shown on the right side of the image, just like any other data set