PostgreSQL Connector & Tableau Visualization
Connecting system_query to PostgreSQL so tools that only support a PostgreSQL connector (not REST) — e.g. Tableau — can pull AnyLog query results.
For software that doesn’t support REST requests, but does support a PostgreSQL connector, graphs can be
generated through the system_query database. To connect system_query to PostgreSQL:
db_ip = 127.0.0.1
db_port = 5432
db_user = admin
db_passwd = passwd
connect dbms system_query where type=psql and ip=!db_ip and port=!db_port and user=!db_user and password=!db_passwd
Setting up Postgres
docker run -d --network host \
  --name anylog-psql \
  -e POSTGRES_USER=${DB_USR} \
  -e POSTGRES_PASSWORD=${DB_PASSWD} \
  -v pgdata:/var/lib/postgresql/data \
  --rm postgres:14.0-alpine
Update Postgres to support remote access if the Postgres (north-bound) connector is on a separate machine.
-
Locate and open
data/postgresql.conf:anylog@anylog-2004:~$ docker volume inspect pgdata [ { "CreatedAt": "2022-01-18T00:46:23Z", "Driver": "local", "Labels": null, "Mountpoint": "/var/lib/docker/volumes/pgdata/_data", "Name": "pgdata", "Options": null, "Scope": "local" } ] anylog@anylog-2004:~$ sudo ls /var/lib/docker/volumes/pgdata/_data [sudo] password for anylog: base pg_commit_ts pg_hba.conf pg_logical pg_notify pg_serial pg_stat pg_subtrans pg_twophase pg_wal postgresql.auto.conf postmaster.opts global pg_dynshmem pg_ident.conf pg_multixact pg_replslot pg_snapshots pg_stat_tmp pg_tblspc PG_VERSION pg_xact postgresql.conf postmaster.pid anylog@anylog-2004:~$ sudo vim /var/lib/docker/volumes/pgdata/_data/postgresql.conf -
Allow remote access — uncomment
listen_addressesand set it to*:listen_addresses = '*' # comma-separated list of addresses; # defaults to 'localhost'; use '*' for all -
Grant remote access — add the following line at the bottom of
data/pg_hba.conf:host all new_user 27.147.176.2/32 md5 -
Restart the PostgreSQL instance:
docker restart anylog-psql
Executing a query
- On AnyLog, connect
system_queryto the Postgres database:
connect dbms psql anylog@127.0.0.1:demo 5432 system_query
- Execute a query:
AL aiops-single-node > run client () sql aiops format=table and table=new_table and drop=true "select increments(hour, 1, timestamp), min(timestamp), min(value), avg(value), max(value) from fic11_mv where timestamp >= NOW() - 1 day"
To run a query like this on a repeating schedule, see repeatable queries — the original reference for this (
alerts and monitoring.md) doesn’t resolve in the current doc tree; confirm the current location before relying on this pointer.
- Use
query explainto see how the result was generated:
AL aiops-single-node > query explain

07 Remote DBMS    : aiops
07 Remote Table   : fic11_mv
07 Source Command : select increments(hour, 1, timestamp), min(timestamp), min(value), avg(value), max(value) from fic11_mv where timestamp >= NOW() - 1 day
07 Remote Query   : select date_trunc('day',timestamp), (extract(hour FROM timestamp)::int / 1), min(timestamp), min(value), SUM(value), COUNT(value), max(value) from fic11_mv where timestamp >= '2022-01-17T18:31:31.442147Z' group by 1,2
07 Local Create   : create table new_table (increments_1_trunc timestamp without time zone, increments_1_extract integer, min_2 timestamp without time zone, min_3 double precision, SUM__value numeric, COUNT__value integer, max_5 double precision);
07 Local Query    : select min(min_2), min(min_3), SUM(SUM__value) /NULLIF(SUM(COUNT__value),0), max(max_5) from new_table group by increments_1_trunc,increments_1_extract order by increments_1_trunc,increments_1_extract
For the full list of SQL query options, see Query Data — Query options.
Extracting data into Tableau
- Download & install Tableau
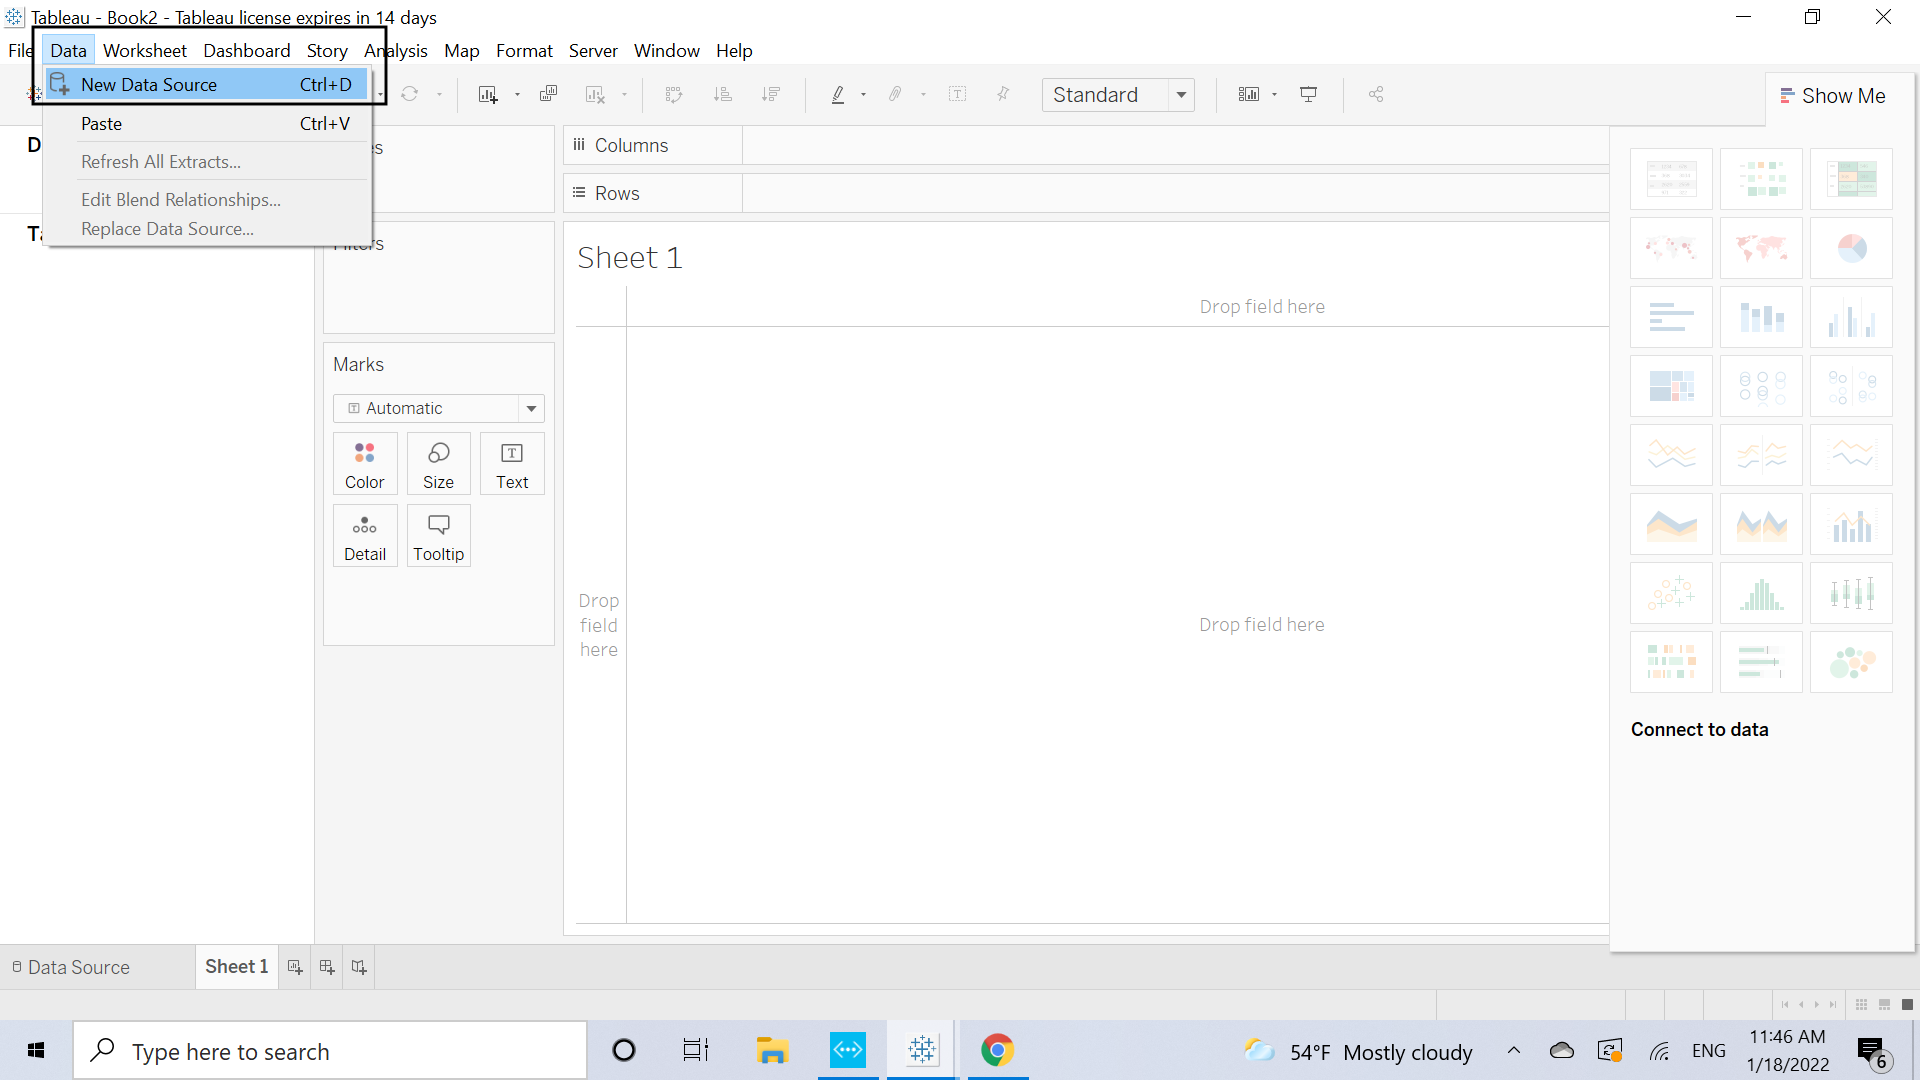
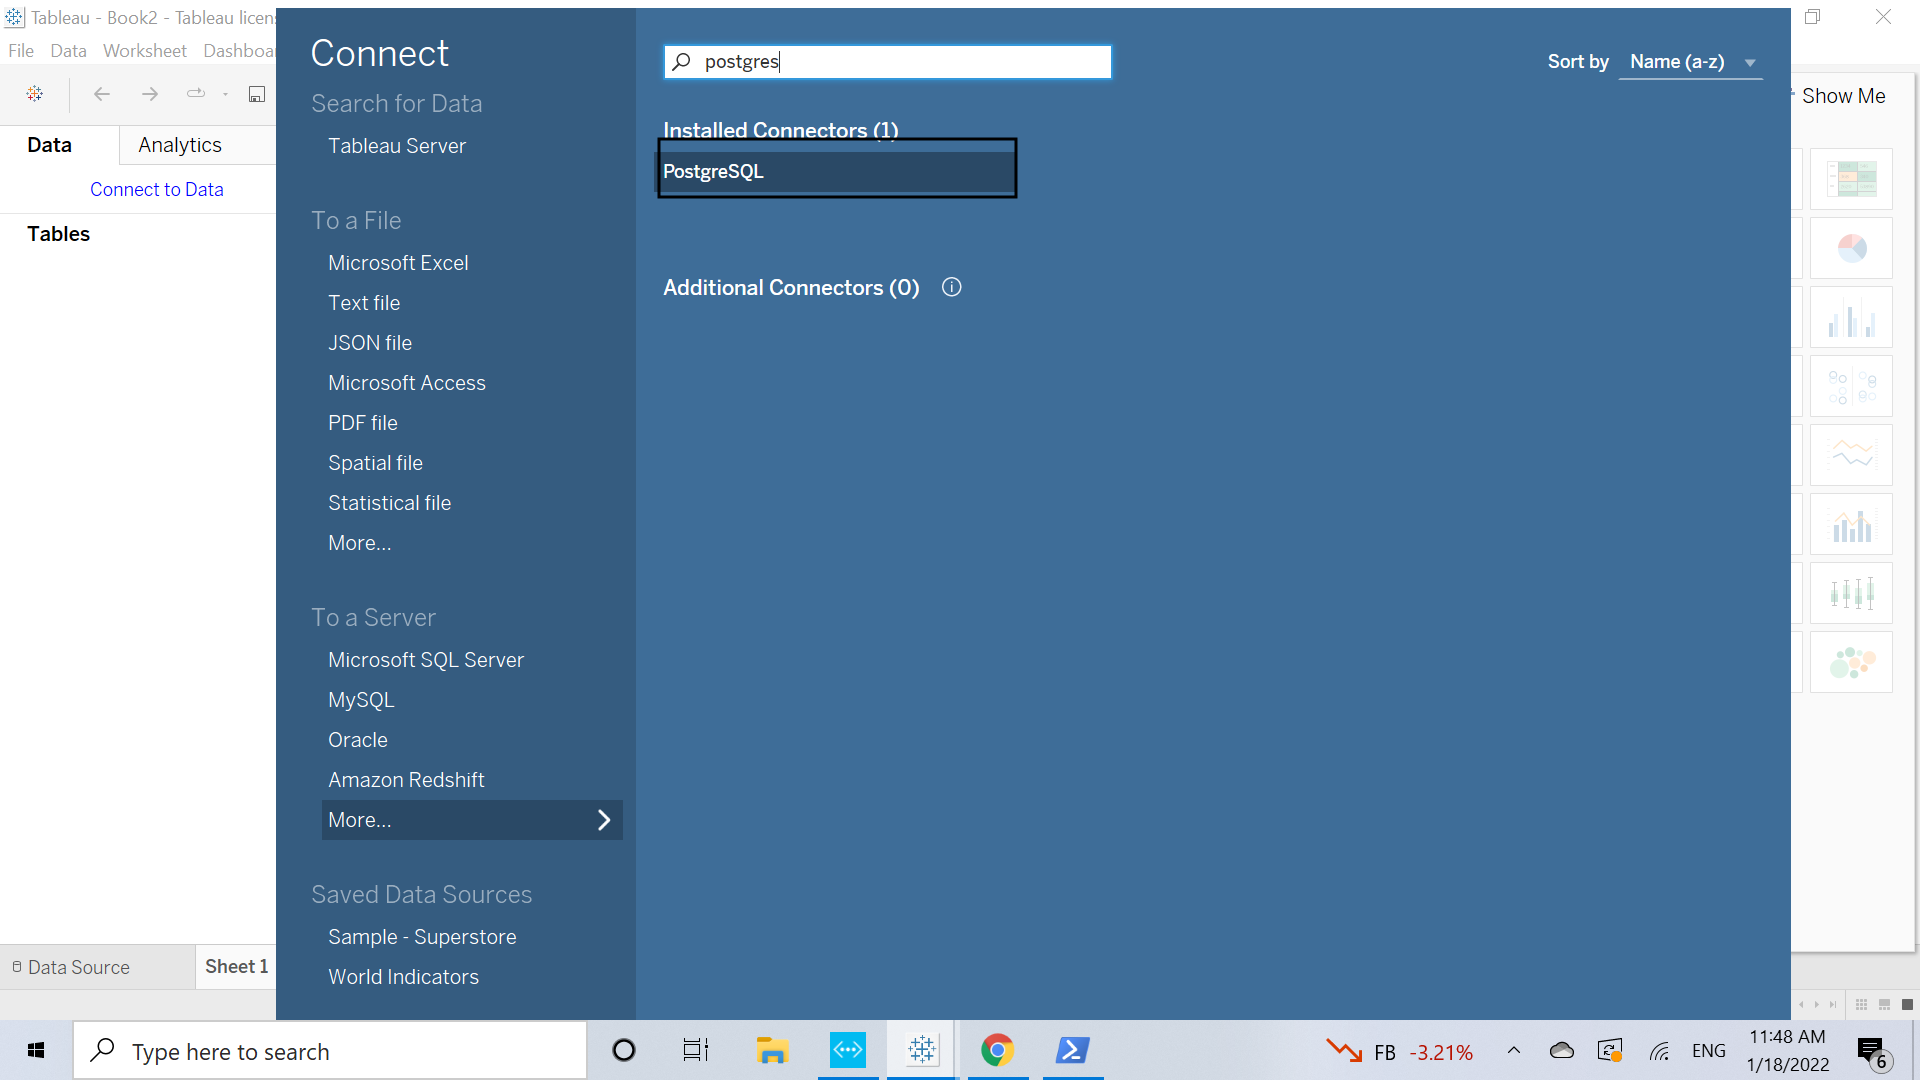
- Under Data → Data Sources, select the PostgreSQL connector type:
 |  |
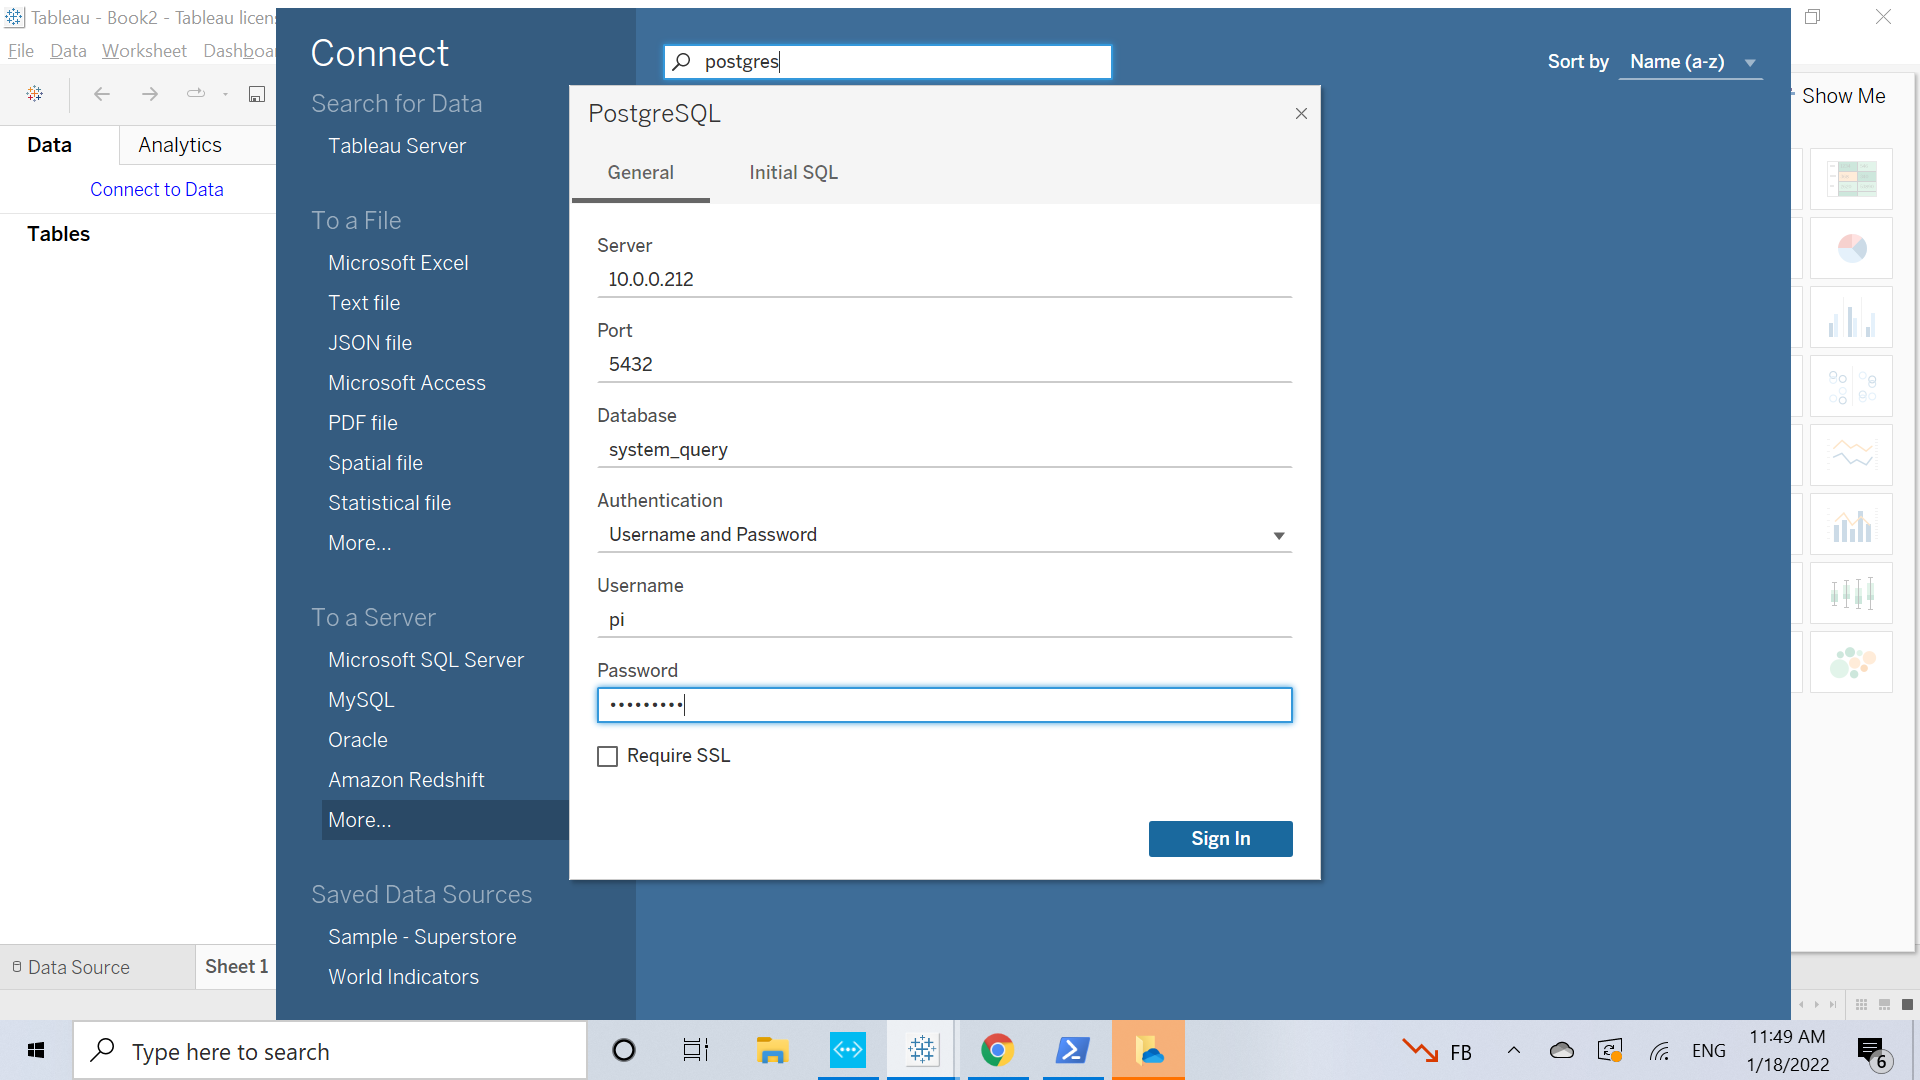
- Fill out the connection information and press “OK”:
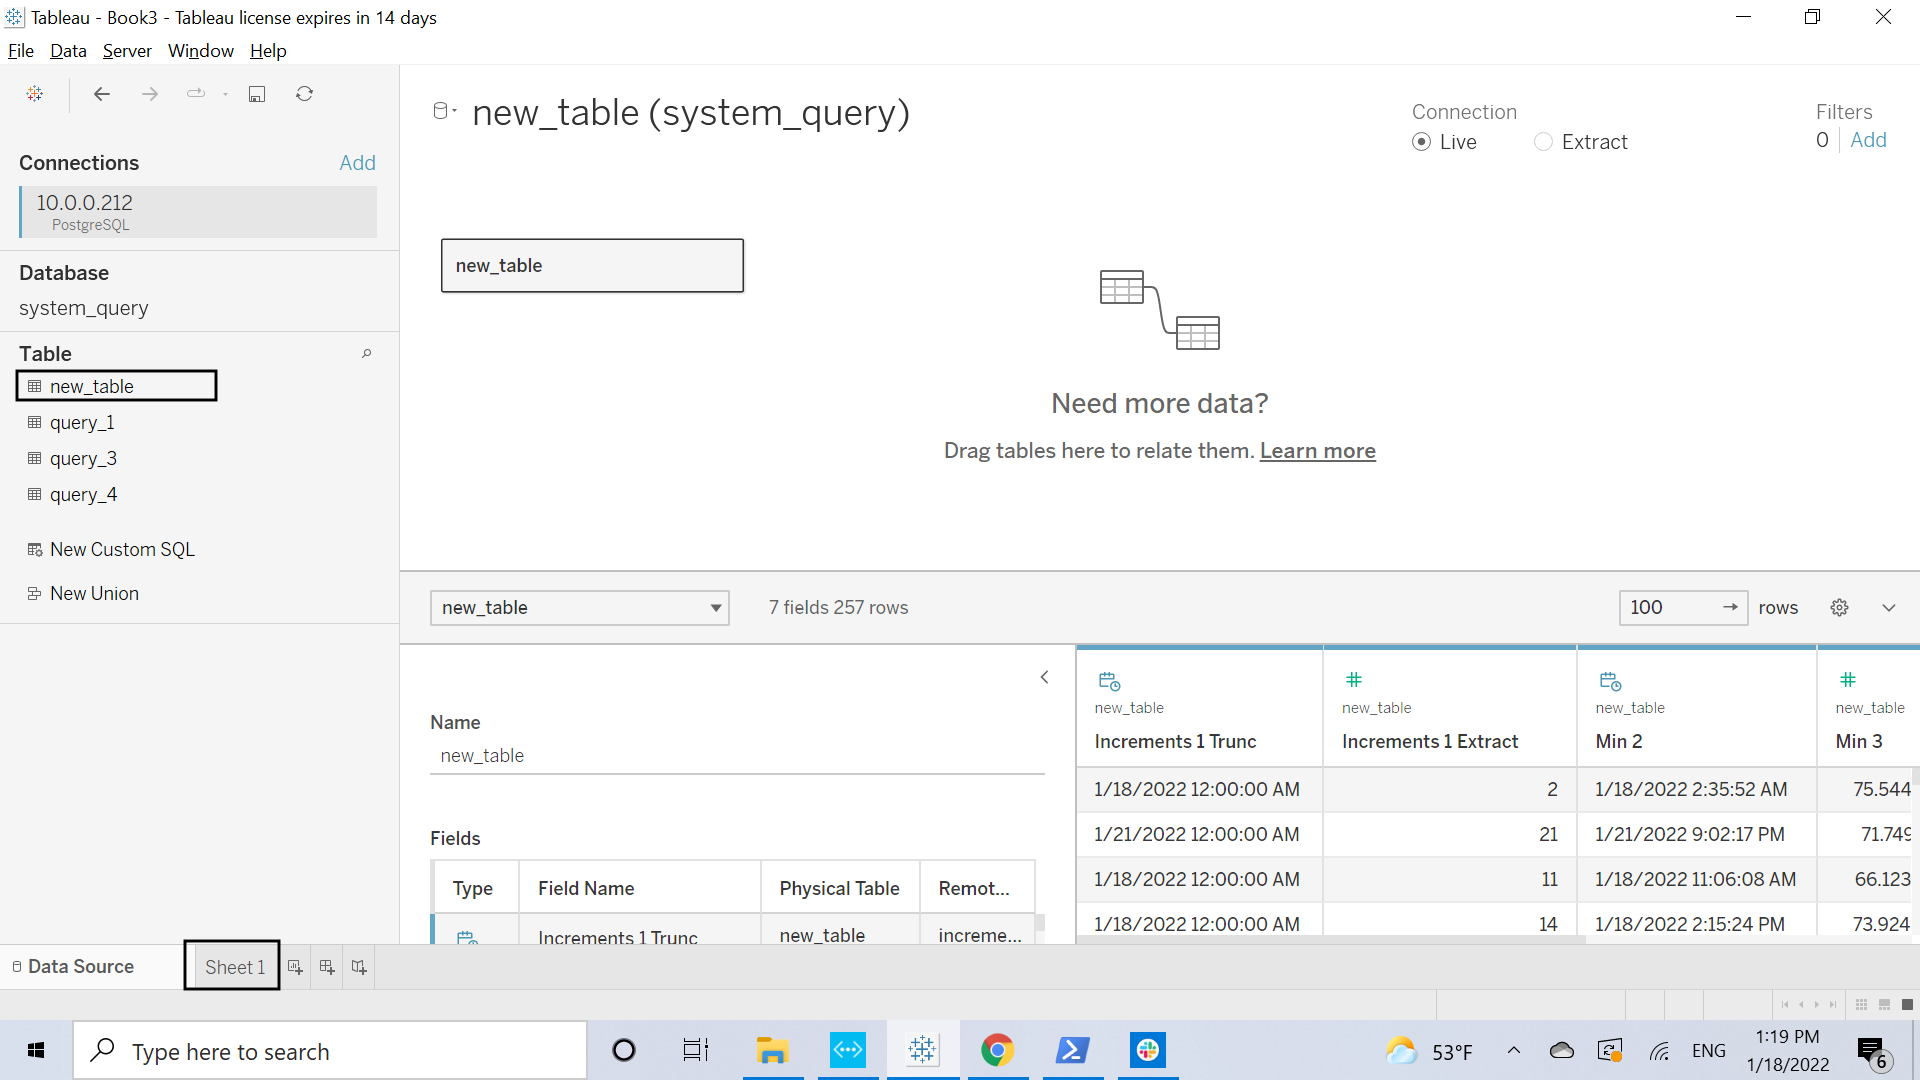
- Double-click on the table you want to use (in this case
new_table) and go to the worksheet:
Generating graphs
The system_query database gathers query results from the different AnyLog instances to generate a unified
dataset. Because of that, mapping the final result columns to something readable takes a little translation:
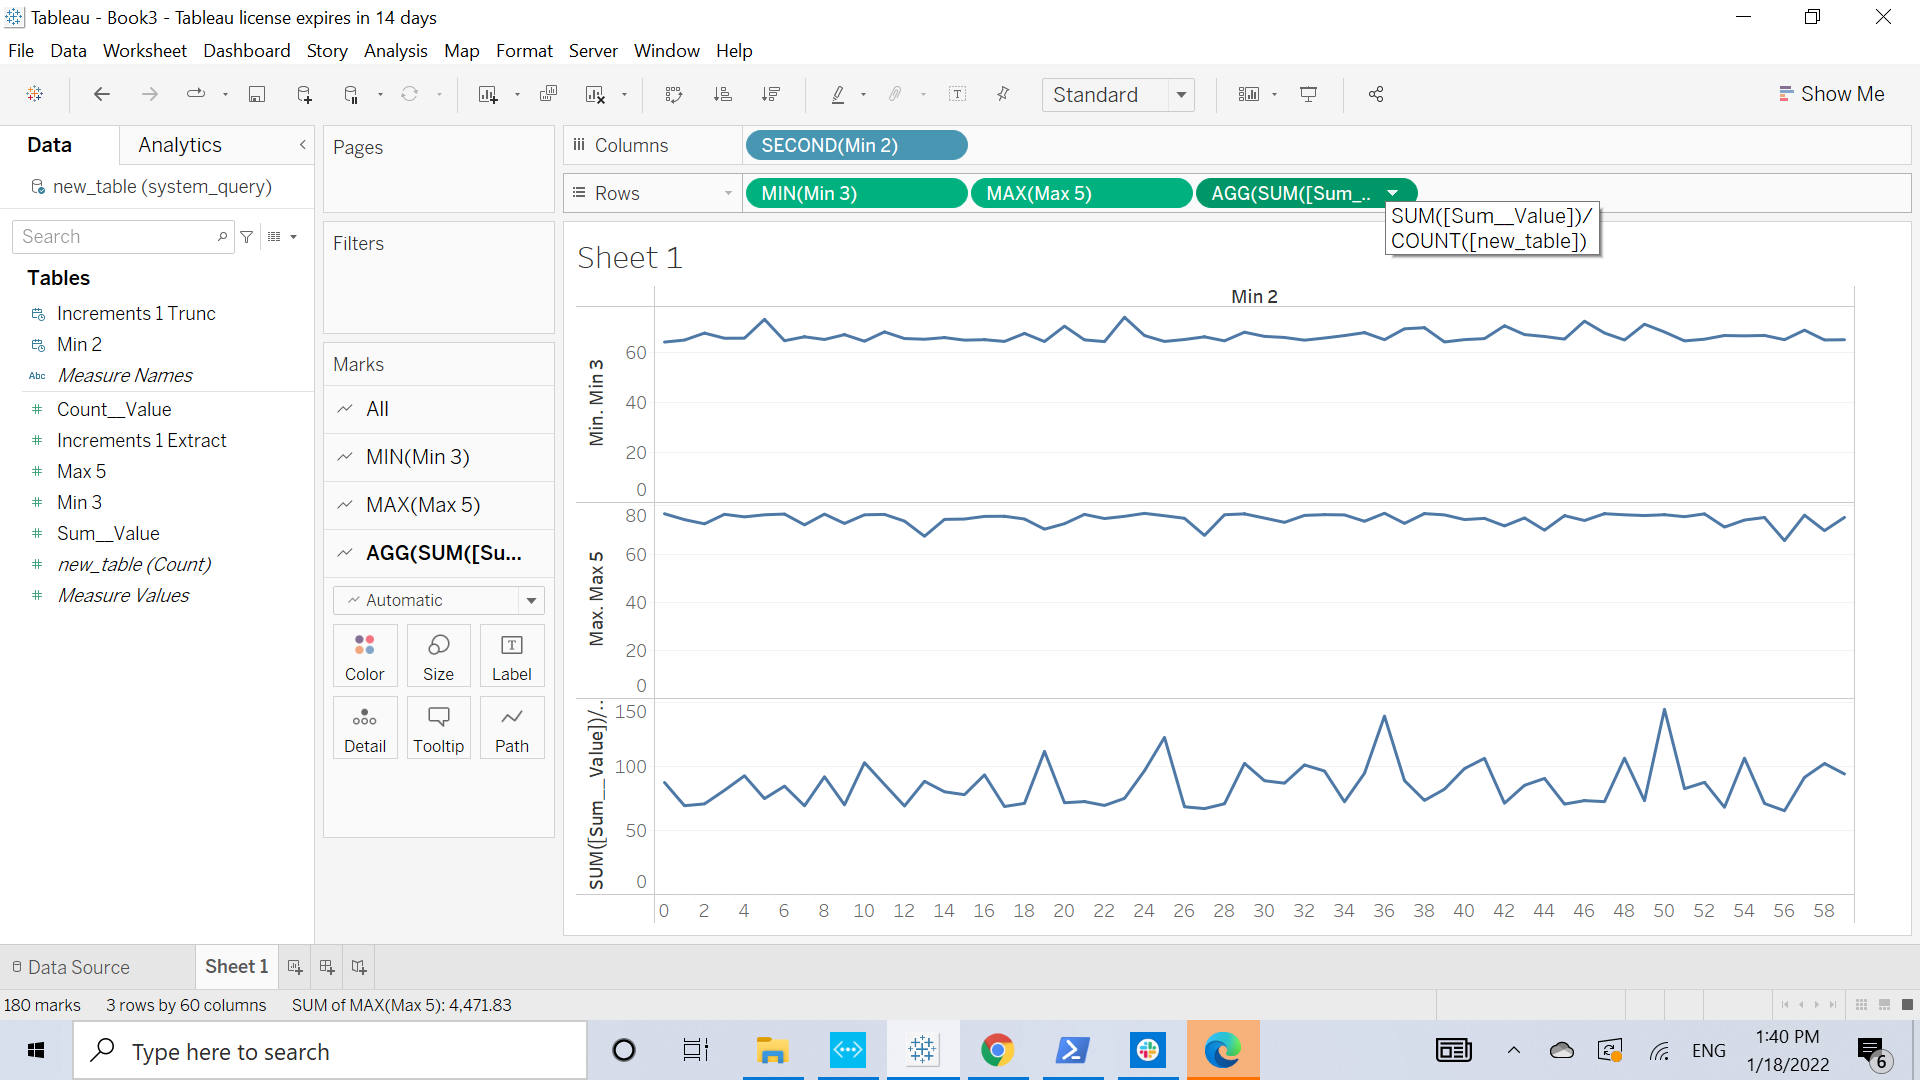
- Min 2 is the
MIN(timestamp)column - Min 3 is the
MIN(value)column - SUM(SUM__VALUE) / COUNT(new_table_count) is the
AVG(value)column - Max 5 is the
MAX(value)column
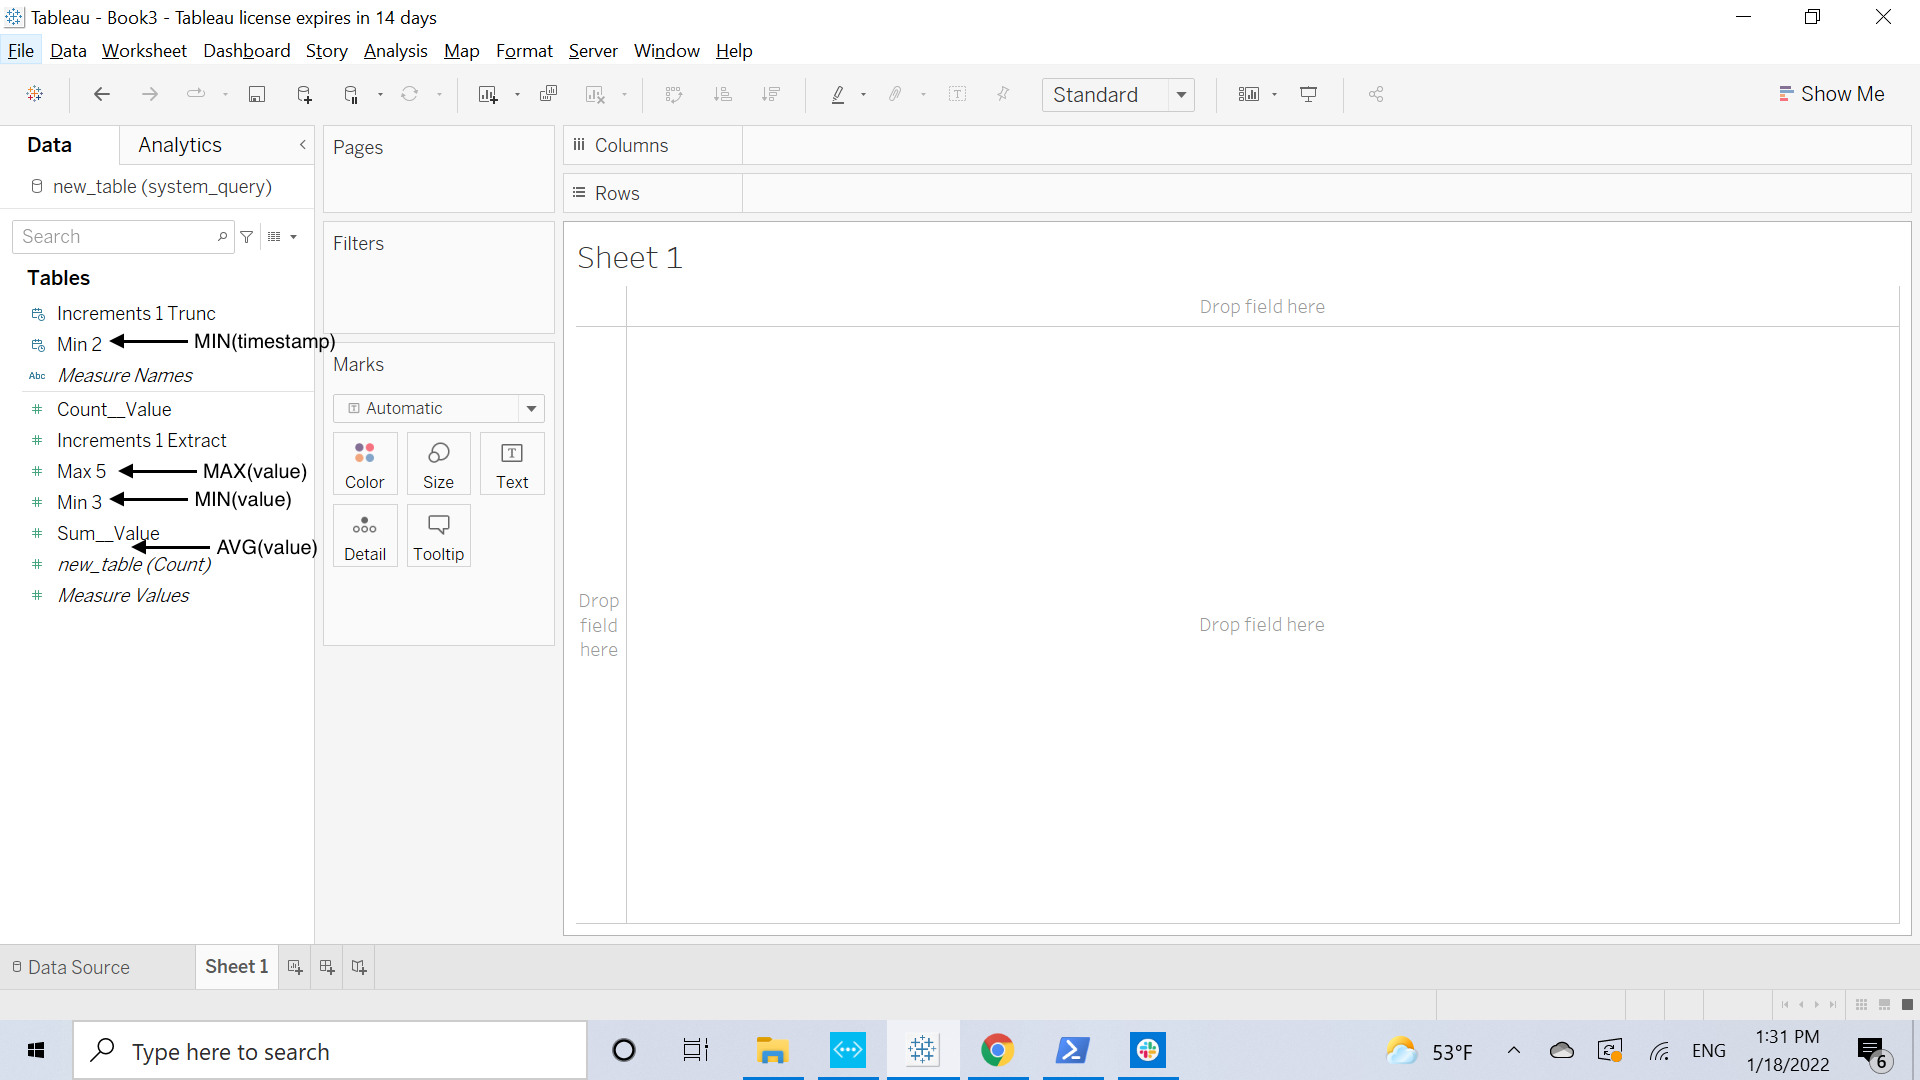
To generate a graph, use “Min 2” as Columns and all the others as Rows: